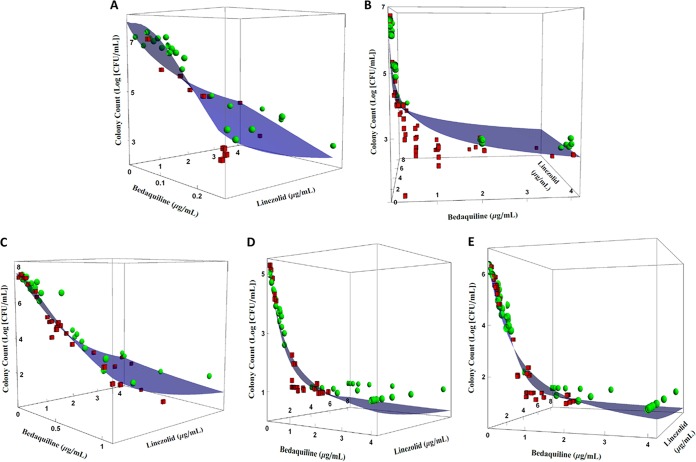
FIG 2.
Effect of LZD and BDQ on total colony counts of M. tuberculosis metabolic states and pH environments according to the URSA model by Greco et al. (17). (A) H37Rv strain in log-phase growth; (B) H37Rv strain in acid phase; (C) 18b strain in log-phase growth; (D) 18b strain in NRP-phase phenotype in acidic pH environment; (E) 18b strain in NRP-phase phenotype in neutral pH environment. Blue surfaces represent model predictions, green spheres represent observations above the fitted surface, and red cubes represent observations below the fitted surface. Experiments were performed in duplicates. Plots show the results from a representative replicate.

