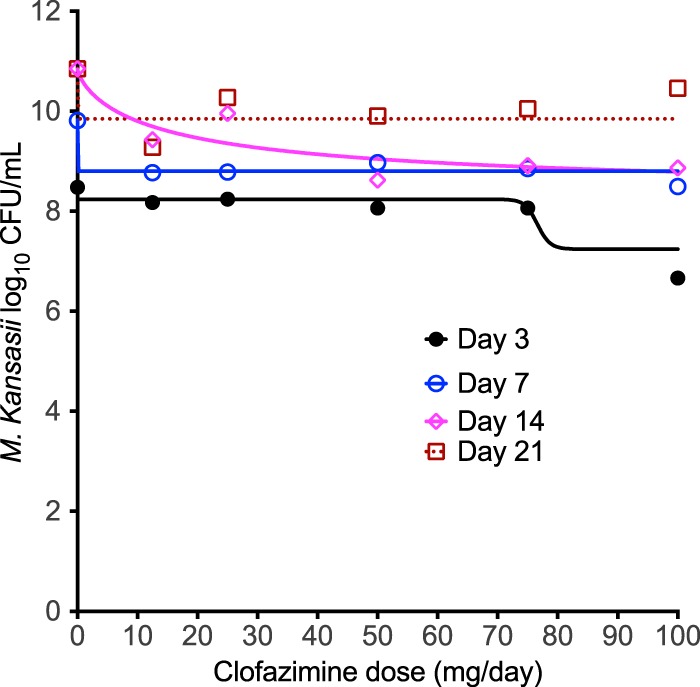
FIG 3.

Clofazimine dose versus bacterial burden in the hollow-fiber system. Each color-coded line shows the inhibitory sigmoid Emax regression, determined with GraphPad Prism software (v 7.0; GraphPad Software, La Jolla, CA, USA), for a specific sampling day. There was one HFS-Mkn unit per dose. The best fit of the model to the data was on day 14 (magenta), and by day 21 (cayenne) it had begun to flatten out.
