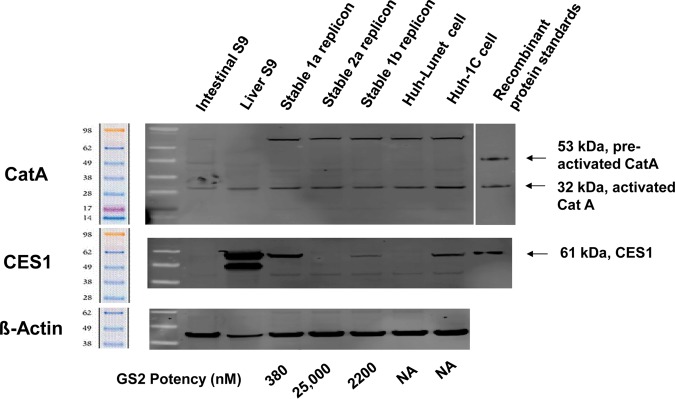
FIG 2.
Comparison of the HCV replicon activity of GS2 to expression of the hydrolases CatA and CES1. Protein levels were visualized by Western blotting. The EC50s for GS2 are 380, 25,000, and 2,200 nM for 1a, 2a, and 1b replicons, respectively. The stable replicon cell lines were individual clones selected from transfected Huh-Lunet cells. Data were from n = 3 to 5 independent experiments done in triplicate. NA, not applicable.

