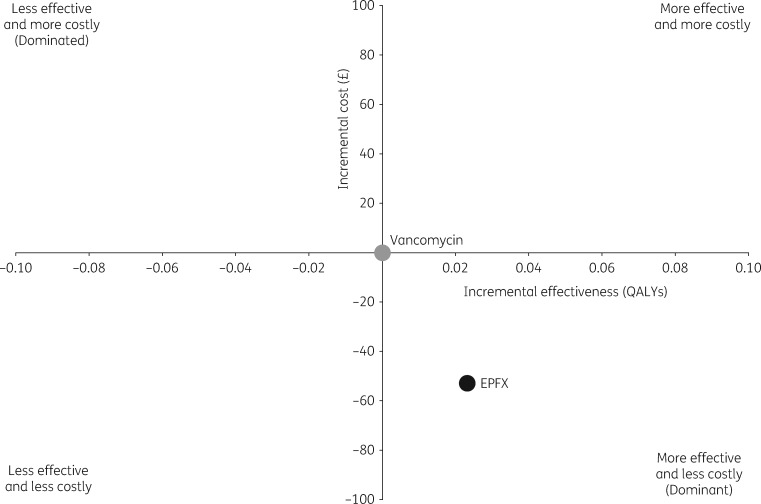
Figure 3.
Model cost-effectiveness plane (base-case analysis). A cost-effectiveness plane consists of four quadrants, where the x-axis represents the incremental level of effectiveness of a new intervention (first-line EPFX in the present model) and the y-axis represents the additional total cost of introducing the new intervention. Standard of care (first-line vancomycin in the current model) occupies the origin of the graph. Depending on the incremental cost-effectiveness ratio, the new intervention will be located to the right or left of the origin if it is more or less effective than standard of care and above or below the origin if it is more or less costly. When a new intervention is both clinically superior and cost saving, it is referred to as an economically ‘dominant’ strategy. The opposite is a ‘dominated’ strategy. EPFX, extended-pulsed fidaxomicin.

