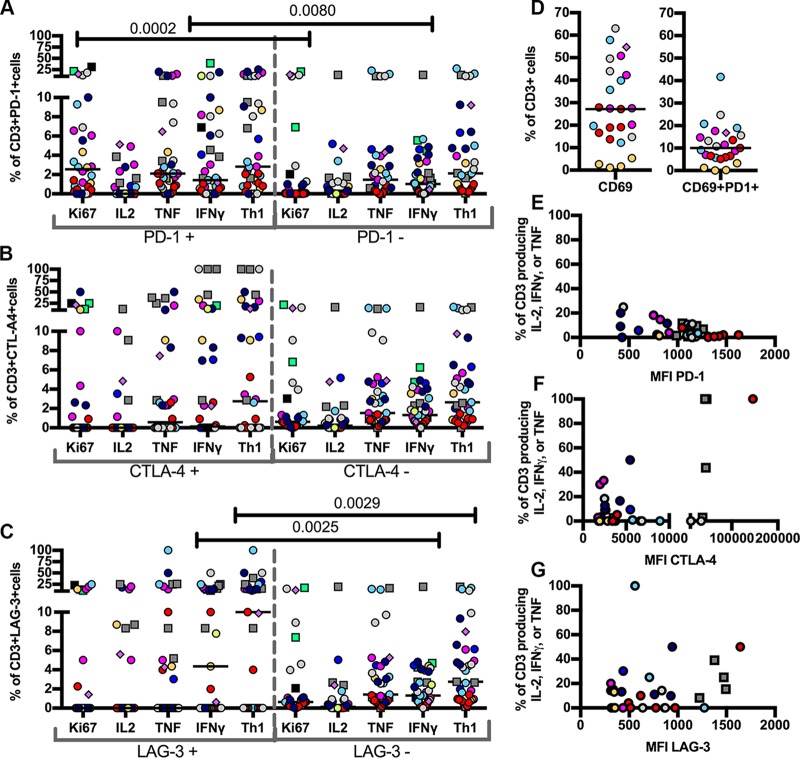
FIG 3.
T cells from two species of NHP expressing inhibitory receptors in lung granulomas, granuloma clusters, and TB pneumonia samples remain functional. Cytokine and Ki67 (proliferation) expression from two NHP species were compared between CD3+ PD-1+ cells and CD3+ PD-1− cells (P values: Ki67 = 0.0002, IL-2 = 0.7631, TNF = 0.1488, IFN-γ = 0.0080, Th1 = 0.0871) (A), CD3+ CTLA-4+ cells and CD3+ CTLA-4− cells (P values: Ki67 = 0.8314, IL-2 = 0.4908, TNF = 0.5207, IFN-γ = 0.0542, Th1 = 0.0907) (B), CD3+ LAG3+ cells and CD3+ LAG3− cells (P values: Ki67 = 0.6295, IL-2 = 0.3294, TNF = 0.2023, IFN-γ = 0.0025, Th1 = 0.0029) (C). Th1 refers to T cells producing IL-2, TNF, or IFN-γ. Each point indicates a lung sample (granuloma, granuloma cluster, or pneumonia), each color corresponds to an NHP (12 NHPs), circles indicate cynomolgus macaques, squares indicate rhesus macaques, and the diamond indicates a TB pneumonia sample. P values are from a Wilcoxon matched-pairs signed-rank test. (D) Frequency of CD69 expression on T cells in the granuloma and coexpression with PD-1 on T cells in the granuloma. Each point indicates a lung sample (granuloma or granuloma cluster), each color corresponds to an NHP (6 NHPs), and the diamond indicates a TB pneumonia sample. Horizontal lines indicate the medians. (E) Median fluorescence intensity (MFI) of expression of PD-1 (Spearman ρ = −0.4319, P = 0.0107) on CD3 T cells negatively correlates with cytokine production. (F and G) In contrast, MFI of CTLA-4 (Spearman ρ = 0.1612, P = 0.37) (F) and LAG-3 (Spearman ρ = 0.1343, P = 0.4712) (G) on CD3 T cells does not correlate with cytokine production. Each point indicates a lung sample (granuloma, granuloma cluster, or pneumonia), each color corresponds to an NHP (12 NHPs), circles indicate cynomolgus macaques, squares indicate rhesus macaques. Correlations were determined by the Spearman ρ test.

