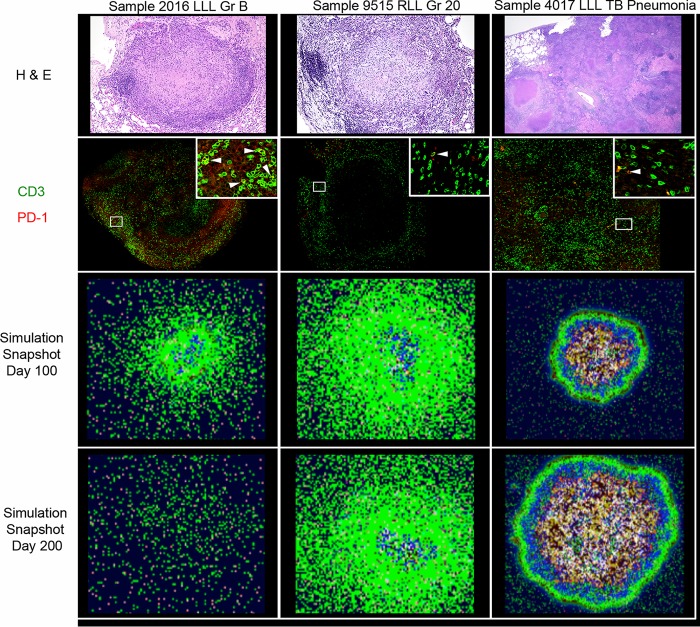
FIG 4.
Comparison of macaque and simulated granulomas with various levels of bacterial burden. Row 1, H&E sections from granulomas excised from NHPs. Row 2, Immunohistochemistry (IHC) staining showing spatial organization of PD-1- and CD3-expressing cells in lung granulomas excised from NHPs (green = CD3, red = PD1). The inset is a magnification of the ROI (indicated by a white box), where arrowheads indicate PD-1+ CD3+ cells. Row 3, Simulated granuloma snapshots at day 100 (near the matching time of necropsy). Row 4, A snapshot prediction of the granuloma outcome if each simulation is continued until day 200. In both rows 3 and 4, colors indicate the following: green, resting macrophages; blue, activated macrophages; orange, infected macrophages; red, chronically infected macrophages; brown, extracellular bacteria; pink, gamma-producing T cells; purple, cytotoxic T cells; aqua, regulatory T cells; and white cross-hatched, caseated.

