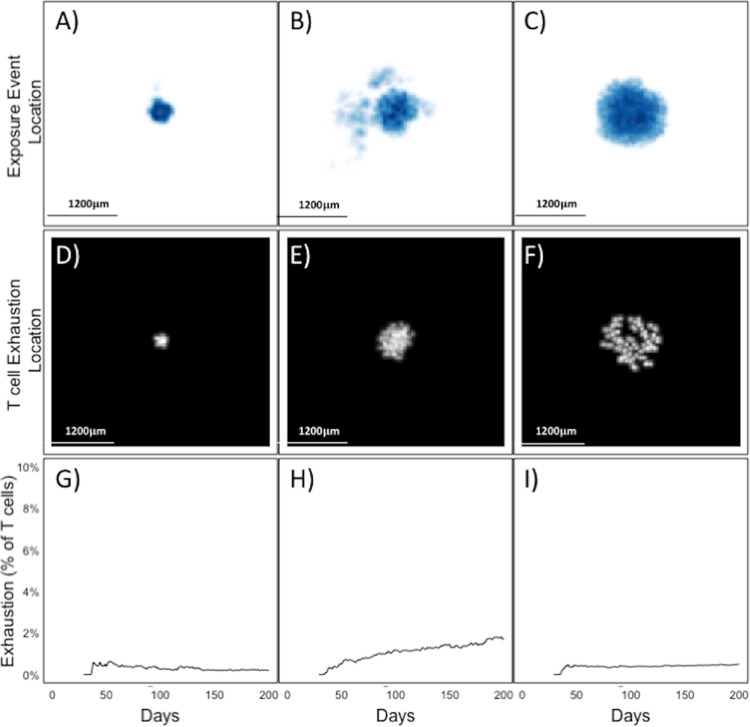
FIG 5.
T cell location within granulomas prevents T cell exhaustion by reducing exposure events. (A, B, and C) Cloud maps showing the location of every EE in sterile, medium CFU, and TB pneumonia simulations. Dark blue represents areas of high numbers of EE, and white represents a lack of EE. (D, E, and F) Heat map location where T cells (cytotoxic or IFN-γ producers) became exhausted. White represents the location of T cells at the time of exhaustion. (G, H, and I) Time series graphs that display cumulative levels of exhaustion (as a percentage of total cytotoxic and IFN-γ producers) within simulations corresponding to panels A to C and panels D to F.

