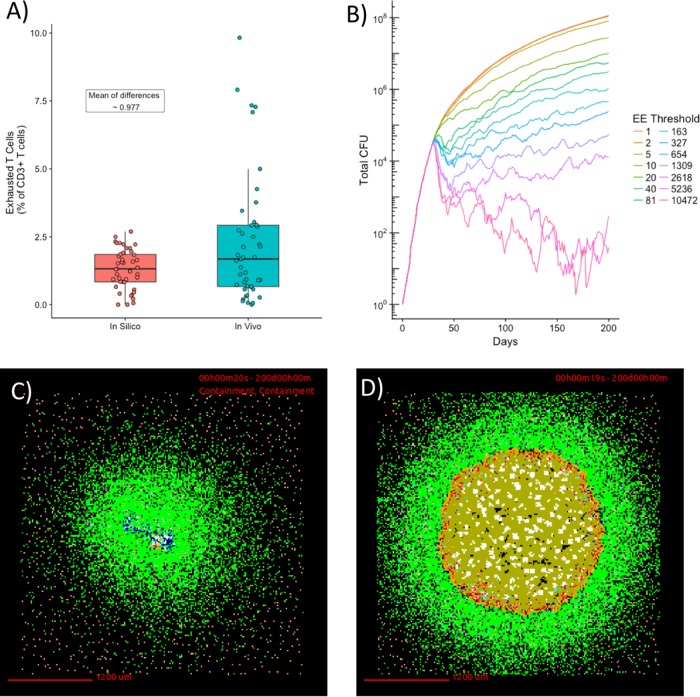
FIG 6.
Artificially increasing T cell exhaustion levels result in bacterial burdens that are not observed experimentally. (A) A box-and-whisker plot demonstrating the distribution of exhaustion levels from NHP studies versus those obtained via simulation in the 44 macaque granulomas (blue) and the simulations that matched (red). (B) Graph of number of CFU versus time at various EE thresholds. (C) Snapshot of granuloma with an EE threshold of 5,236 taken at day 200. This granuloma represents a biologically feasible outcome and had a bacterial burden of 288 CFU. (D) Snapshot of granuloma with an EE threshold of 1 taken at day 200. This granuloma had a bacterial burden of 115,192,400 CFU.

