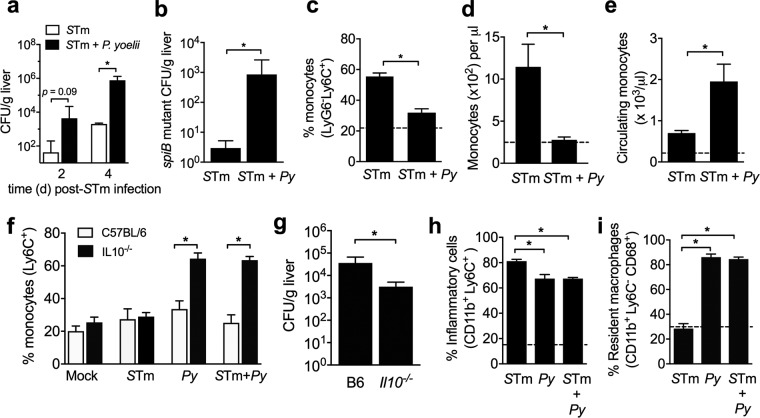
FIG 1.
(a) Colonization (as the number of CFU) of the liver at 2 and 4 days after IG infection of P. yoelii-infected or uninfected CBA/J mice with S. Typhimurium (n = 3 or 4). Data are shown as the mean ± SEM. Statistical significance was determined using an unpaired Student t test on log-transformed values. *, P < 0.05. (b) Number of CFU in the liver at 5 days after IG infection of P. yoelii-infected or uninfected CBA/J mice with an SPI-2 T3SS S. Typhimurium mutant (spiB) (n = 10). Data are shown as the mean ± SEM and represent the results from two independent experiments. (c, d) Percentage (c) and number (d) of inflammatory monocytes (CD11b+ Ly6G− Ly6C+) in the liver from S. Typhimurium-infected and coinfected mice (n = 4 to 5). The number of inflammatory monocytes (singlet live CD3− B220− NK1.1− CD11b+ Ly6G− Ly6C+) per 4 × 10⁶ liver cells was determined by the use of AccuCount beads. Data are shown as the mean ± SEM. The dotted line represents the average for two mock-infected controls. (e) Number of circulating monocytes (103 per microliter) determined by complete blood counts (n = 4 to 5). The dashed line represents the average for two mock-infected controls. Data are shown as the mean ± SEM. (f) Percentage of inflammatory monocytes (CD11b+ Ly6G− Ly6C+) in the liver from wild-type C57BL/6J Slc11a1+/+ and C57BL/6J Slc11a1+/+ Il10−/− mice infected with P. yoelii or S. Typhimurium, coinfected mice, or uninfected controls. Data are shown as the mean ± SEM and represent the results from two independent experiments (n = 4 to 7). (g) Number of CFU in the liver from wild-type C57BL/6J (B6) Slc11a1+/+ and C57BL/6J Slc11a1+/+ Il10−/− coinfected mice at 2 days postinfection with S. Typhimurium (n = 4 to 7). Data are shown as the mean ± SEM and represent the results from two independent experiments. (h) Percentage of inflammatory phagocytes (singlet live CD3− B220− Nk1.1− CD11b+ Ly6C+) in the liver from S. Typhimurium-infected, P. yoelii-infected, and coinfected mice (n = 4 to 9). (i) Percentage of liver macrophages (singlet live CD3− B220− Nk1.1− CD11b+ Ly6C− CD68+) from S. Typhimurium-infected, P. yoelii-infected, and coinfected mice (n = 4 to 9). Data are shown as the mean ± SEM. For panels b to i, statistical significance was determined using an unpaired Student t test on log-transformed or arc-sin-transformed values. *, P < 0.05. Stm, S. Typhimurium; Py, P. yoelii. See also Fig. S1 in the supplemental material.

