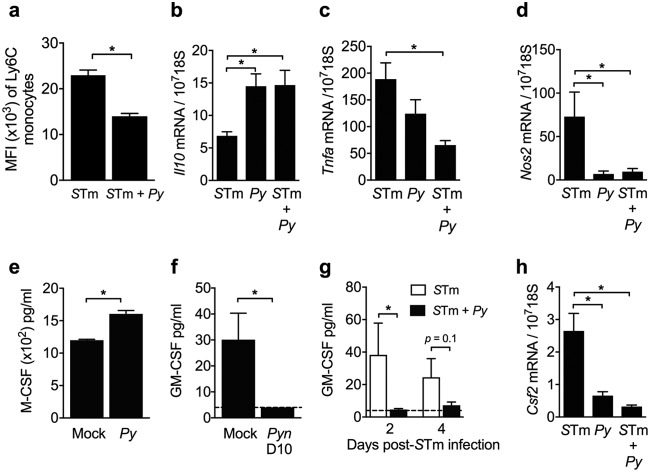
FIG 2.
(a) Median fluorescent intensity (MFI) of surface Ly6C on liver monocytes in the CD11b+ population from S. Typhimurium-infected and coinfected mice at 4 days after S. Typhimurium infection (n = 4 to 5). Data represent the mean ± SEM. CD11b+ liver cells were enriched by positive selection from S. Typhimurium-infected, P. yoelii-infected, and coinfected CBA/J mice at 4 days after S. Typhimurium infection (n = 3 to 9). (b to d) Expression of IL-10 (Il10) (b), TNF-α (Tnfa) (c), and Nos2 (Nos2) (d) determined by quantitative RT-PCR. Data represent the mean ± SEM and are from two independent experiments. (e, f) Circulating levels of M-CSF (e) and GM-CSF (f) from mock-infected and P. yoelii-infected mice at day 10 (D10) after parasite infection (n = 3 to 4). Data represent the mean ± SEM. The dotted line represents the detection limit of 4 pg/ml. (g) Circulating GM-CSF concentrations in S. Typhimurium-infected and coinfected mice at 2 and 4 days after S. Typhimurium infection (n = 3 to 4). Data represent the mean ± SEM. The dashed line represents the detection limit of 4 pg/ml. (h) Expression of GM-CSF (Csf2) from CD11b+ liver cells isolated from S. Typhimurium-infected, P. yoelii-infected, and coinfected mice 4 days after S. Typhimurium infection (n = 3 to 9). Data represent the mean ± SEM and are from two independent experiments. Statistical significance was determined using an unpaired Student t test on log-transformed values. *, P < 0.05. See also Fig. S2 in the supplemental material.

