
FIG 3.
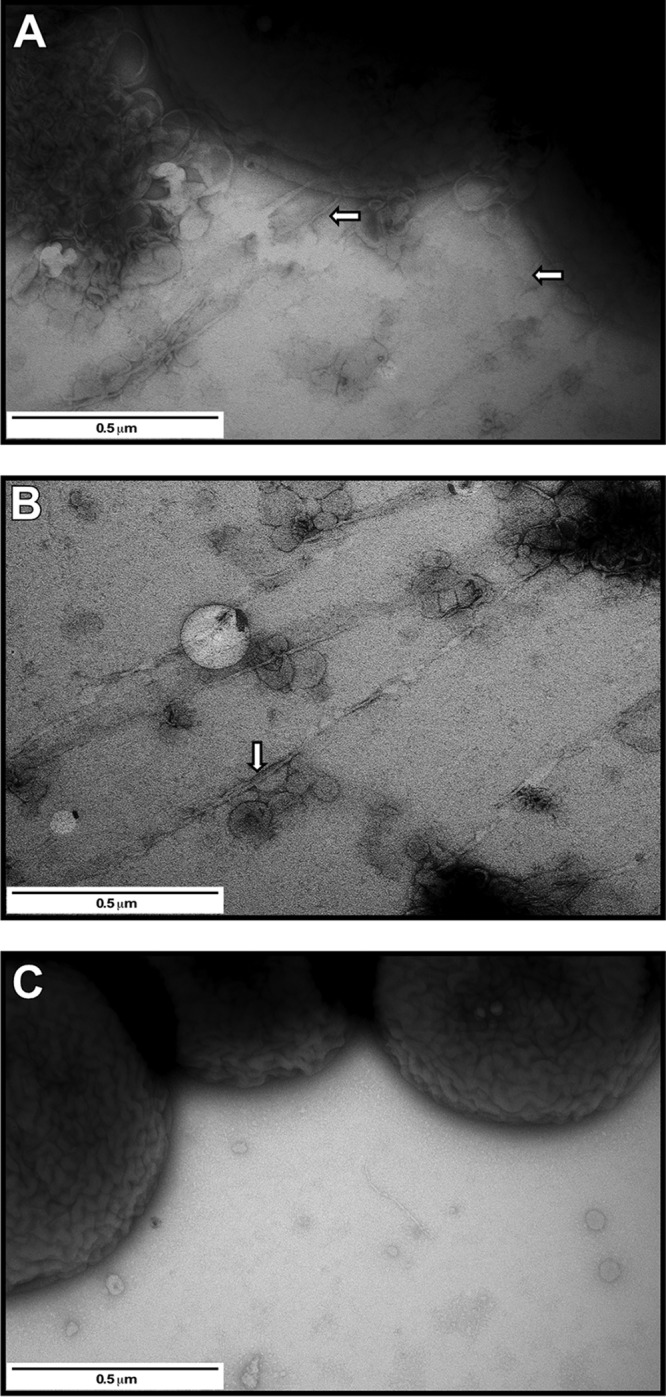
TEM analysis of samples collected from the surface of SA plates. (A and B) TEM grids were placed substrate-side down on 17978 cells at the edge of the motility zone (A) or immediately in front of this zone, where cells were not visible (B). (C) Micrograph of cells lifted from the edge of the colony formed by the nonmotile 17978.prpA mutant. The white arrows in panels A and B identify pili attached to bacterial cells as well as pili present in front of the motility zone. Plates were incubated overnight at 24°C under darkness. Images are representative of at least three fields of view for each sample at a ×50,000 magnification.