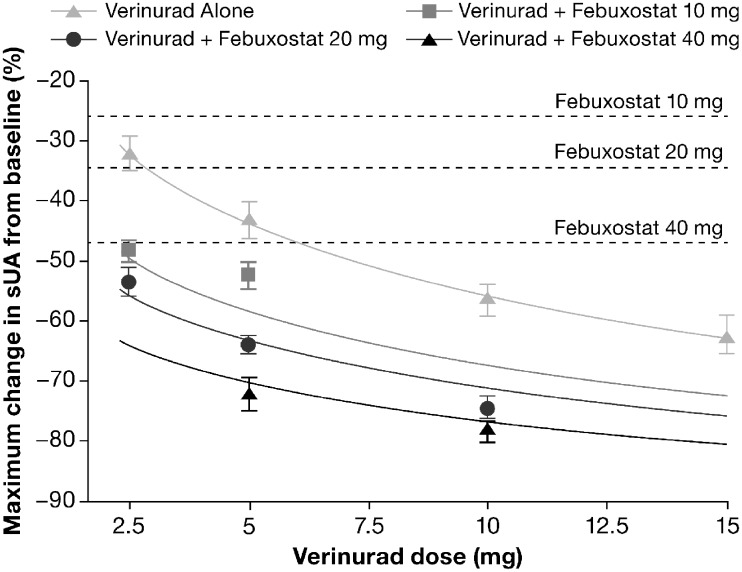
Fig. 3.
Mean (s.e.) Maximum percentage change in sUA: verinurad, febuxostat or verinurad combined with febuxostat
Solid lines are predictive trend lines based on additive changes from febuxostat and verinurad at various doses. Dashed horizontal lines represent the maximum change in sUA from baseline with febuxostat alone. Pharmacodynamic analysis set, pooled cohort data. sUA: serum urate.

