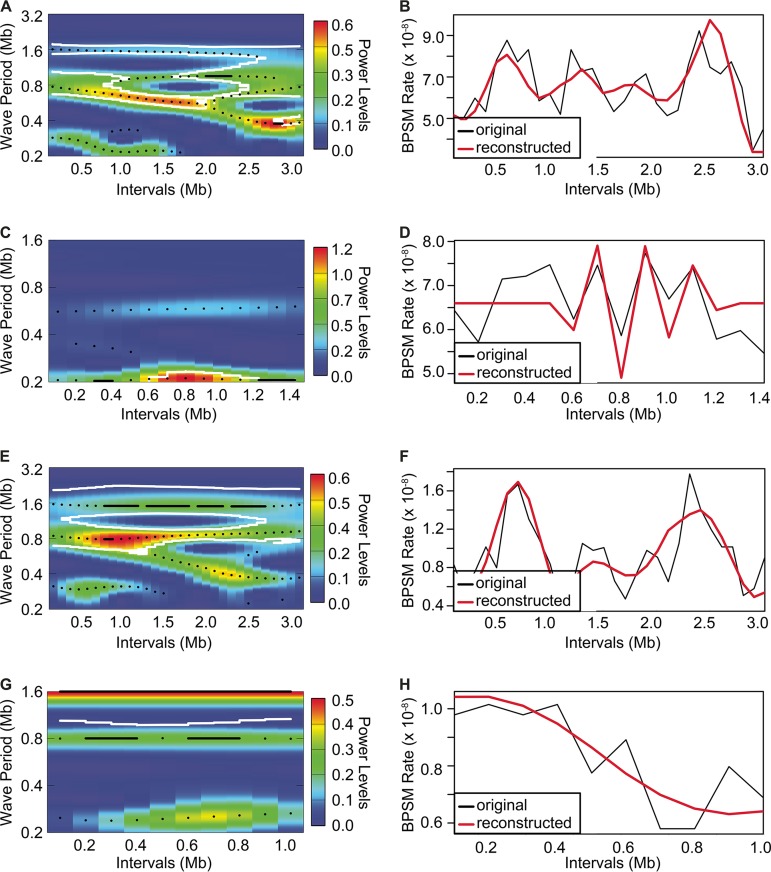
FIG 4 .
Wavelet power spectrum and resultant reconstruction of the patterns of base substitution mutation (bpsm) rates in 100-kb intervals extending clockwise from the oriCI region of chromosome 1 (A and B, V. fischeri; E and F, V. cholerae) and the oriCII region of chromosome 2 (C and D, V. fischeri; G and H, V. cholerae) using the MMR-deficient mutation accumulation lineages. Wavelet power analyses follow an interval color key (A, C, E, and G), where colors code for the power values at each interval in the genome for all possible wave periods, from dark blue (low power) to dark red (high power). White contour lines denote a significance cutoff of 0.1. Reconstructed series were generated using only the wave periods whose average power was significant over the entire interval (B, D, F, and H).

