FIG 2 .
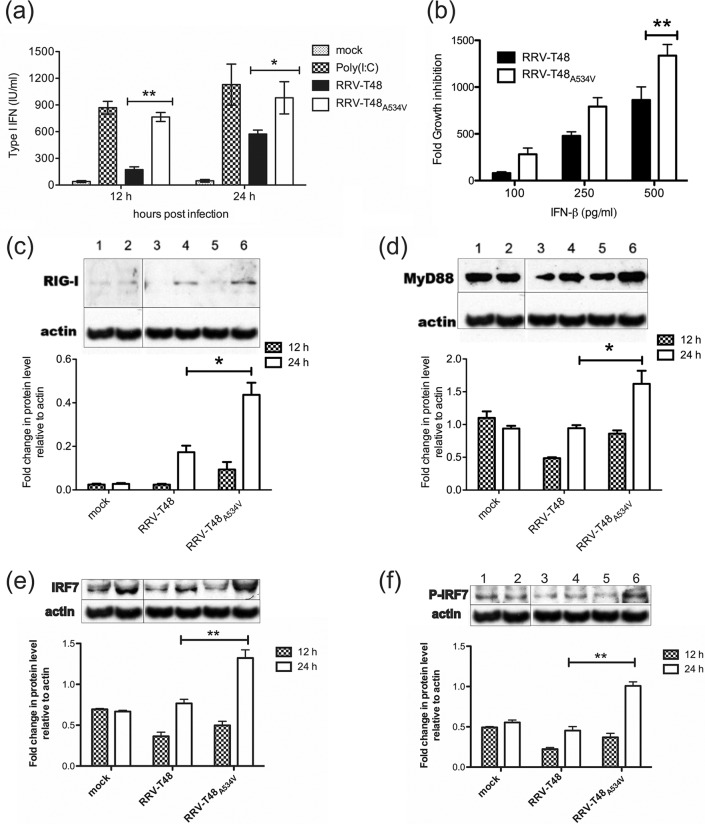
Type I IFN induction and sensitivity of RRV-T48 and RRV-T48A534V and comparison of expression levels of type I IFN signaling proteins in RRV-T48- and RRV-T48A534V-infected L929 cells. (a) L929 cells were infected with RRV-T48 or RRV-T48A534V at an MOI of 0.1. Transfection with poly(I · C) was used as a positive control for type I IFN induction. Supernatants were collected at 12 h and 24 h p.i./p.t. (posttransfection), and type I IFN levels were determined by IFN bioassay. (b) Vero cells were infected by either RRV-T48 or RRV-T48A534V at an MOI of 0.1. Infected cells were treated with increasing concentrations of human IFN-β. The cell culture supernatants were collected at 24 h p.i. and analyzed using plaque assay. The sensitivity of RRV-T48 and RRV-T48A534V to type I IFN is represented by a decrease in viral titer resulting from IFN-β treatment. (c to f) For analysis of expression levels of type I IFN signaling proteins, L929 cells were mock infected or infected with RRV-T48 or RRV-T48A534V at an MOI of 0.1. Cell lysates were collected at 12 h and 24 h p.i. and analyzed by Western blotting using antibodies recognizing RIG-I (c), MyD88 (d), IRF7 (e), and phospho-IRF7 (P-IRF7) (f). β-Actin was used as loading control. Bands were quantified using ImageJ software. Results are represented as fold change over β-actin. In all panels, error bars represent SEM from three independent experiments (*, P < 0.05; **, P < 0.01 using two-way ANOVA with Bonferroni post hoc test).

