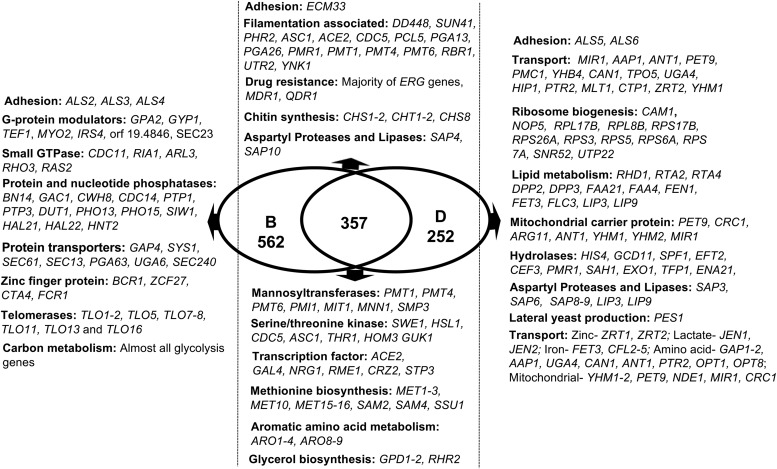
FIG 1 .
Venn diagram of significantly upregulated genes in biofilms and biofilm dispersal cells at 24 h, compared to planktonic cells. Gene expression profiles of C. albicans biofilm (B) and biofilm dispersal cells (D) were each compared individually to age-matched planktonic cells (P). The Venn diagram displays the total number of genes upregulated under each growth condition and those common between biofilms and dispersed cells. The diagram also shows some genes and their functional categories (additional to those mentioned in the body of the manuscript) whose levels are elevated in each group.

