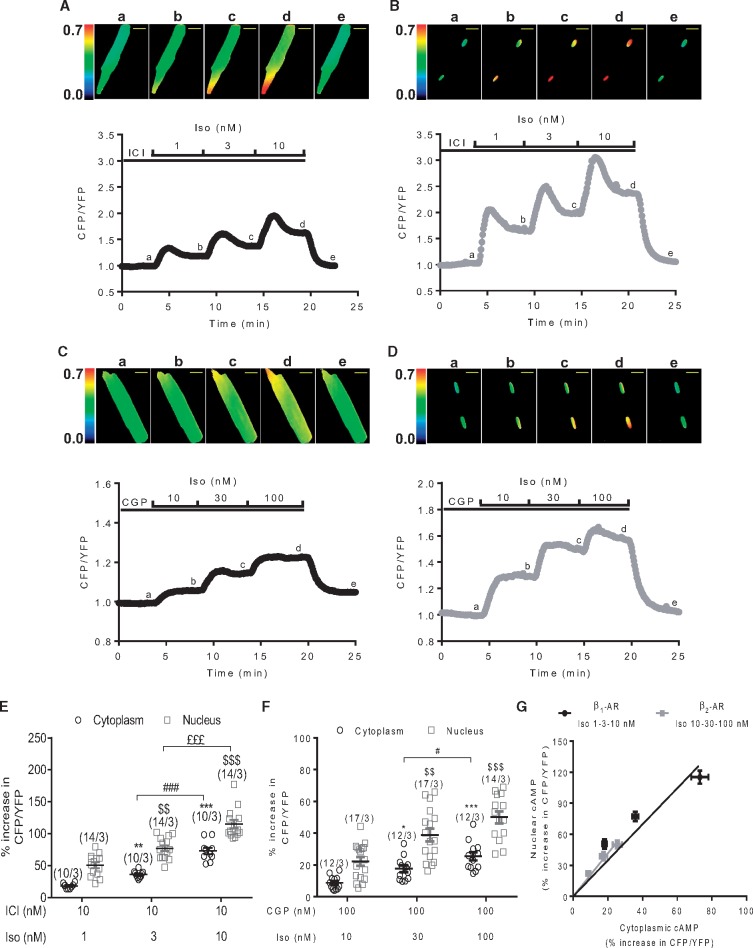
Figure 2.
Both β1- and β2-AR increase cytoplasmic and nuclear cAMP levels in ARVMs. Representative time course of the normalized CFP/YFP ratio upon selective β1-AR stimulation with Iso (1, 3, and 10 nM) in combination with 10 nM ICI (A and B) or β2-AR stimulation with Iso (10, 30 and 100 nM) in combination with 100 nM CGP (C and D) in ARVMs transduced with Ad.Epac-SH187(A and C) or Ad.Epac-SH187-3NLS (B and D) for 24 h at a MOI of 1000 active viral particles/cell. Pseudo-colour images of the CFP/YFP ratio were recorded at the times indicated by the letters on the graphs. Scale bars represent 20 µm. (E and F) Mean variation (±S.E.M.) of the CFP/YFP ratio in ARVMs expressing either Epac-SH187 or Epac-SH187-3NLS upon β1-AR stimulation (E) or β2-AR stimulation (F). Number of cells/animals is indicated in brackets. Statistical significance is indicated as * P < 0.05; ** P < 0.01; *** P < 0.001 vs. ICI+Iso 1 nM or CGP+Iso 10 nM in the cytoplasm, $$P < 0.01, $$$P < 0.001 vs. ICI+Iso 1 nM or CGP+Iso 10 nM in the nucleus, #P< 0.05, ###P < 0.001, £££P < 0.001 by nested ANOVA with Tukey’s post-hoc test. (G) Nuclear cAMP elevation (% increase in CFP/YFP ratio in ARVMs expressing Epac-SH187-3NLS) is plotted as a function of cytoplasmic cAMP elevation (% increase in CFP/YFP ratio in ARVMs expressing Epac-SH187) in response to either β1- or β2-AR stimulation. Values (±S.E.M.) of (E and F) were used for this graph.

