Figure 3.

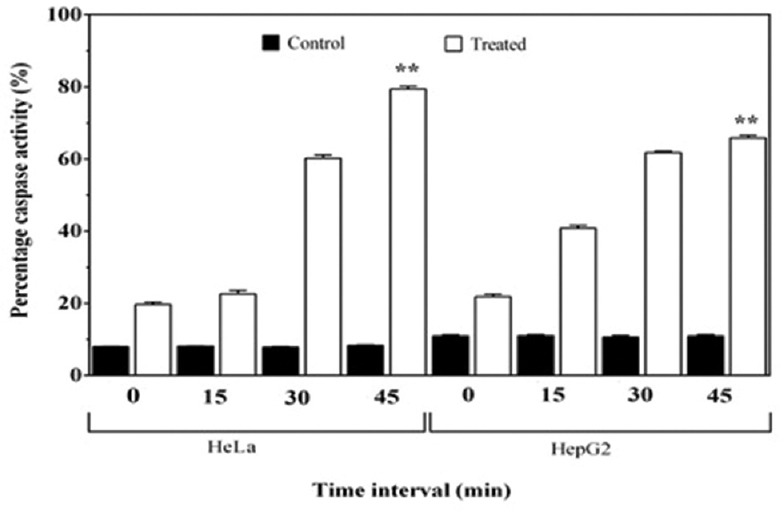
Comparison of percentage caspase activity between treated and control HepG2 and HeLa cells, with respect to time interval (0–45 min). Each bar represents the mean of three replicates. **indicatesP< 0.001 in comparison to the control

Comparison of percentage caspase activity between treated and control HepG2 and HeLa cells, with respect to time interval (0–45 min). Each bar represents the mean of three replicates. **indicatesP< 0.001 in comparison to the control