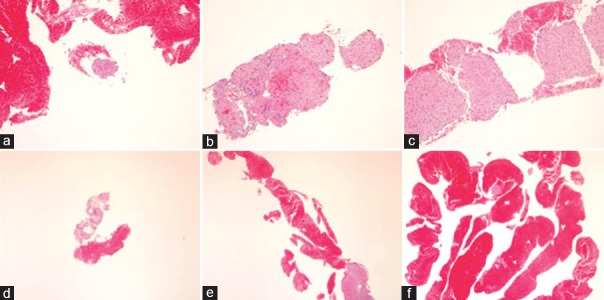
Figure 2.
(a) Amount of core tissue score 2 (a tissue fragment; a cell cluster). (b) Amount of core tissue score 3 (a small histological core tissue; <×10 objective, field diameter = 2.2 mm). (c) Amount of core tissue score 4 (a large histological core tissue; >×10 objective, filed diameter = 2.2 mm). (d) Amount of blood score 1 (none– few). (e) Amount of blood score 2 (moderate). (f) Amount of blood score 3 (high)

