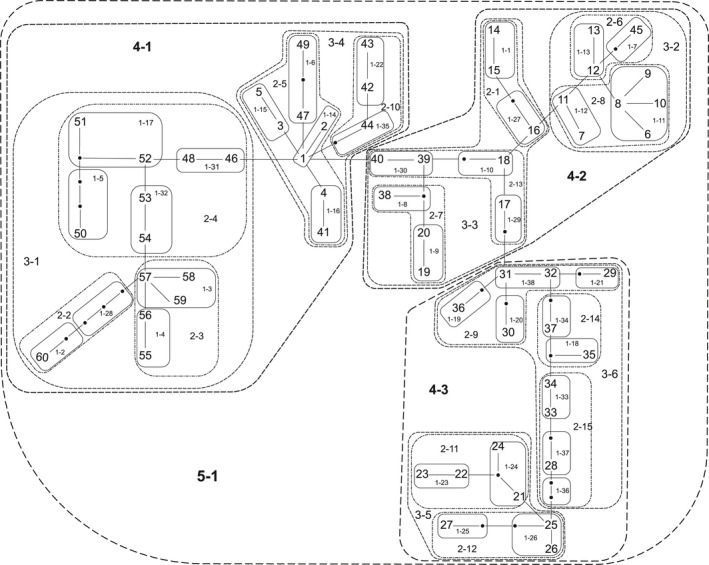
Figure 4.

Nested Vibrio fischeri haplotype network generated from molecular data acquired in the Philippines during 2010, 2012, 2013, and 2015. Each haplotype is represented by a two‐digit identifier (see Figure 3), with each hierarchical nesting level represented by a two‐ to three‐digit dashed identifier and enclosed within dashed and dotted lines. Lines between haplotypes represent the mutational steps required to transition from one genetic station to another, with the small black dots representing unsampled haplotypes
