
Figure 2.
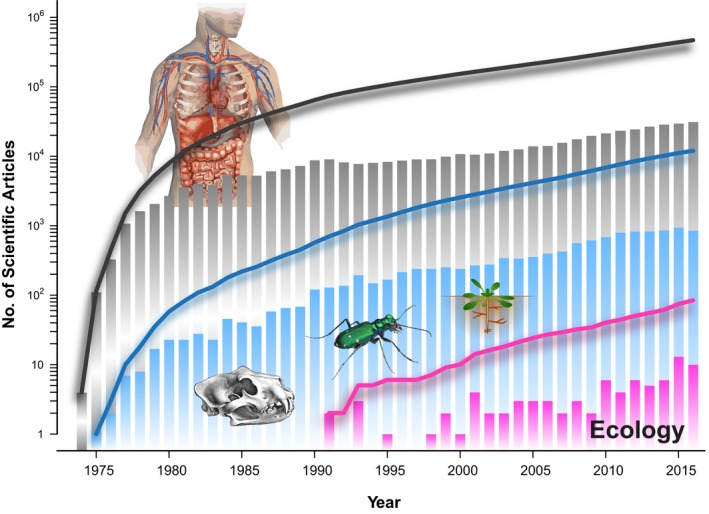
Historical analysis of the usage of x‐ray computed tomography in scientific studies by means of Thomson‐Reuters's ISI on the Web of Science (all databases). Dark gray: total number (primary search terms), blue: biological sciences (primary search terms plus secondary filtering to exclude studies dealing with human and animal medicine and livestock production), dark pink: manually refined selection of ecological studies. Bars represent the annual count of publications and lines the cumulative sum. Results showed on the y‐axis (presented in logarithmic scale) were obtained using a combination of search term and research areas explained in the text. Beetle image © Alex Wild, used by permission