Figure 2.

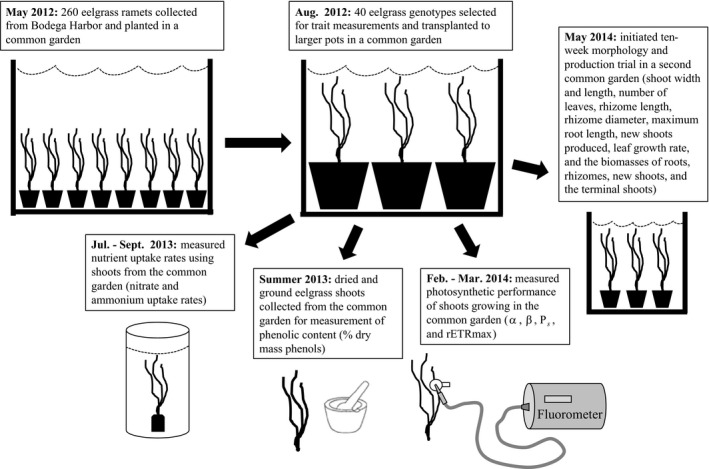
Diagram summarizing the work flow of the experiment from genotype collection to trait measurements. Text boxes describe each step, and any traits measured during a step are listed in parentheses in the text

Diagram summarizing the work flow of the experiment from genotype collection to trait measurements. Text boxes describe each step, and any traits measured during a step are listed in parentheses in the text