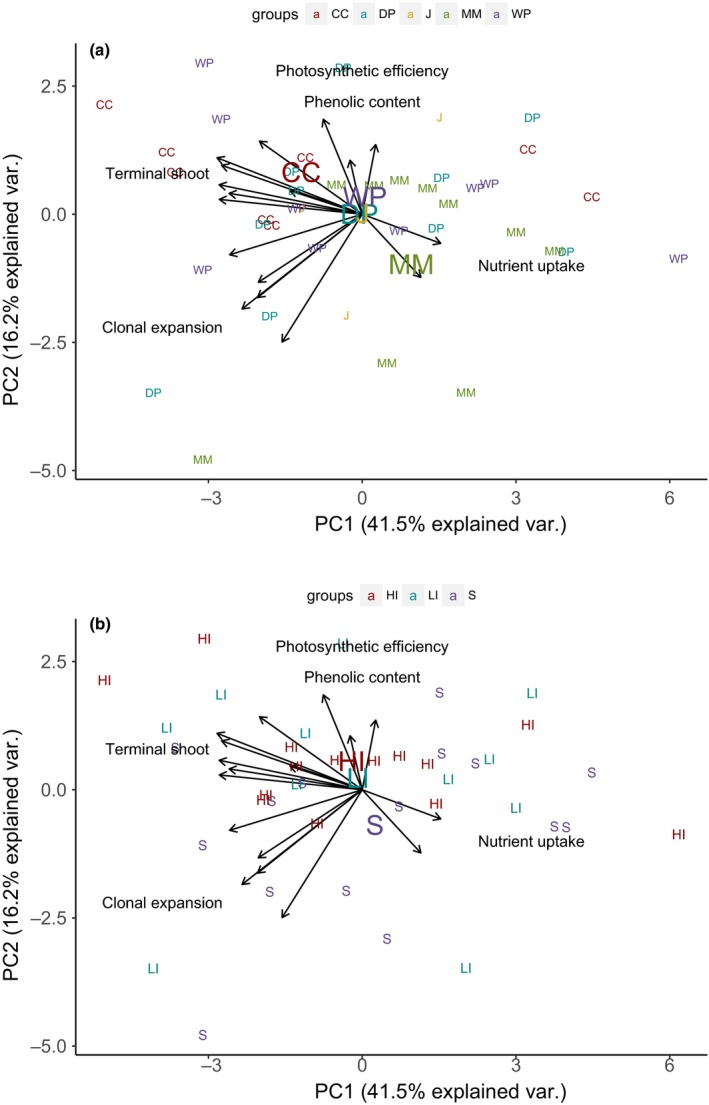
Figure 3.

Principal components biplot depicting how the 40 genotypes differ in their traits across the two most significant principal components axes. The loadings for the 17 different trait measurements are represented by arrows, and the PC scores for the 40 genotypes are depicted by color‐coded labels (smaller font) for the site (a) or tidal height (b) from which the genotypes were collected (CC = Campbell Cove, DP = Doran Park, J = Jetty, MM = Mason's Marina, WP = Westside Park, HI = high intertidal, LI = low intertidal, S = subtidal). For ease of interpretation, instead of labeling all traits, major trait groupings are listed in the area where their arrows occur. “Nutrient uptake” includes both nitrate and ammonium uptake rates. “Clonal expansion” includes the mass and length of rhizome growth and number and mass of newly produced shoots. “Terminal shoot” includes morphological traits, mass, and growth rate of the terminal shoot. Color‐coded, larger font, site (a), or tidal height (b) labels are placed at the centroid of PC1 and PC2 scores for genotypes from each site or tidal height
