Figure 1.

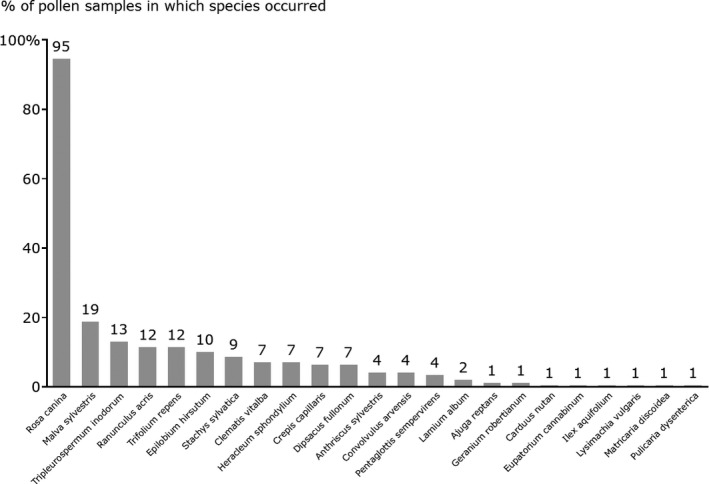
Bar chart displaying, for all 136 pollen samples sequenced successfully, the percentage of samples, in which each plant species was recorded

Bar chart displaying, for all 136 pollen samples sequenced successfully, the percentage of samples, in which each plant species was recorded