
Figure 4.
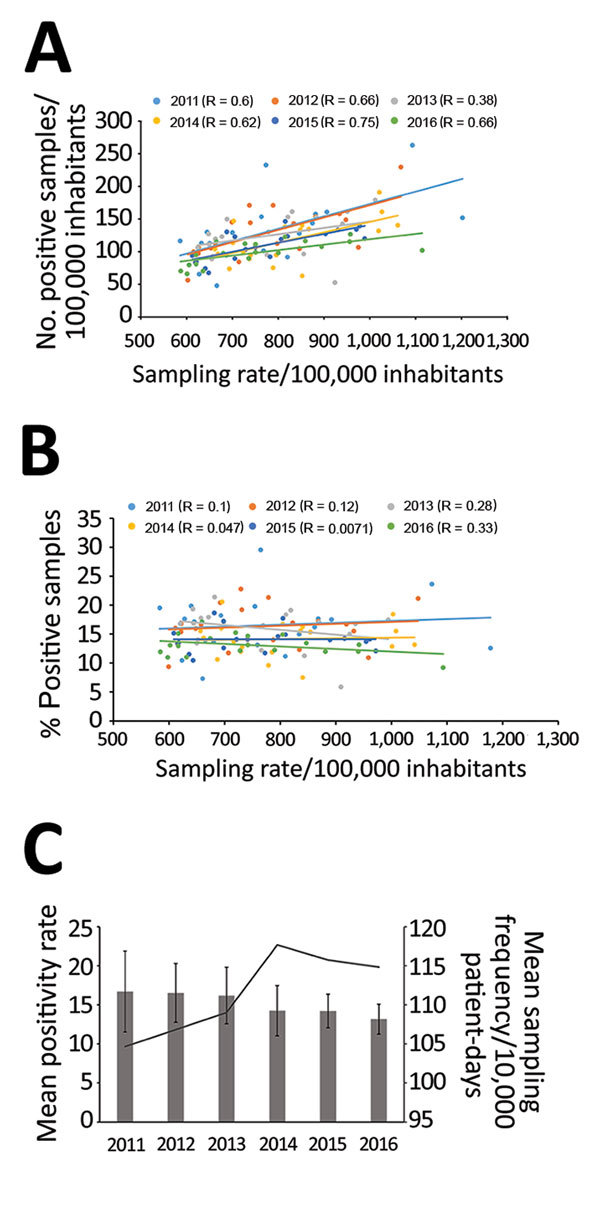
Correlation between Clostridioides difficile infection (CDI) cases and sampling rates, Sweden, 2009–2016. A) Correlation between number of positive CDI cases/100,000 inhabitants per county and sampling rates. B) Correlation between percentage of CDI cases and sampling rates. Dots indicate values per county; lines indicate regression analyses (R values as indicated). C) Mean positivity rate (bars) and mean sampling frequency (line), by year. Error bars show interlaboratory SD in positivity rates.