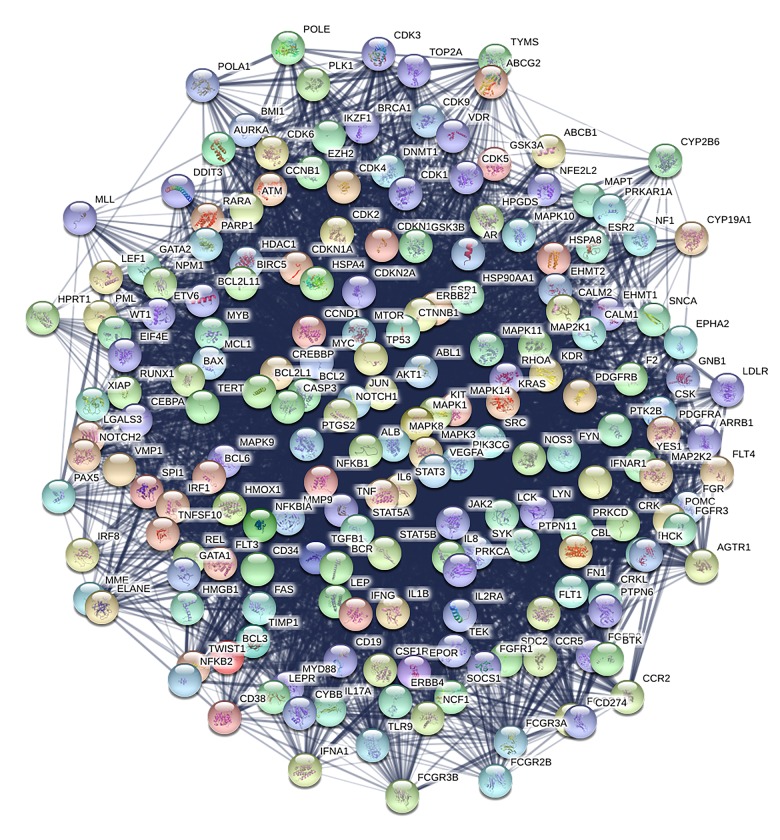
Figure 5.
The network of 195 major hubs based on their direct interactions, consisting of 195 nodes and 5943 edges. Nodes represent proteins. Colored nodes are query proteins and first shell of interactors. White nodes are second shell of interactors. Empty nodes are proteins of unknown 3D structure. Filled nodes have some 3D structure known or predicted. Edges represent protein-protein associations and line thickness indicates the strength of data support.

