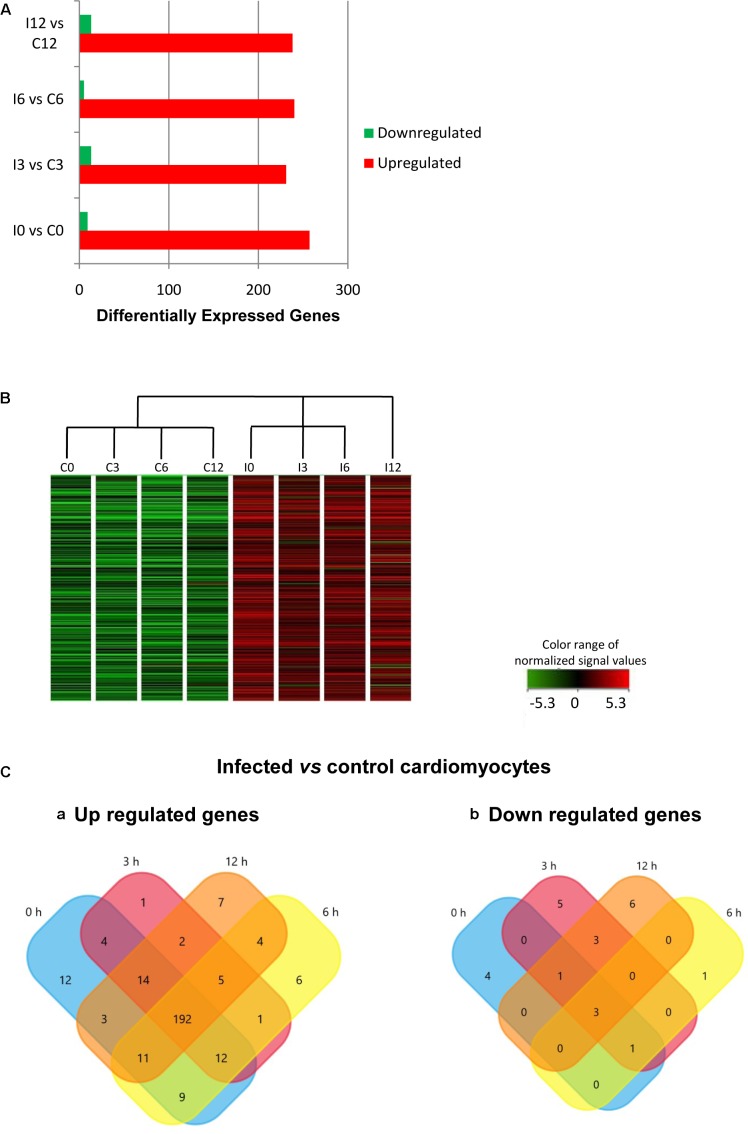
FIGURE 1.
Differential gene expression in response to Trypanosoma cruzi infection. (A) Comparative expression at times 0, 3, 6, and 12 hpi (fold change ≥ 2; p ≤ 0.01). (B) Hierarchical clustering of the differentially expressed genes. (C) Venn diagrams comparing (a) up-regulated and (b) down-regulated genes from infected vs. control cardiomyocytes at the different times post infection.

