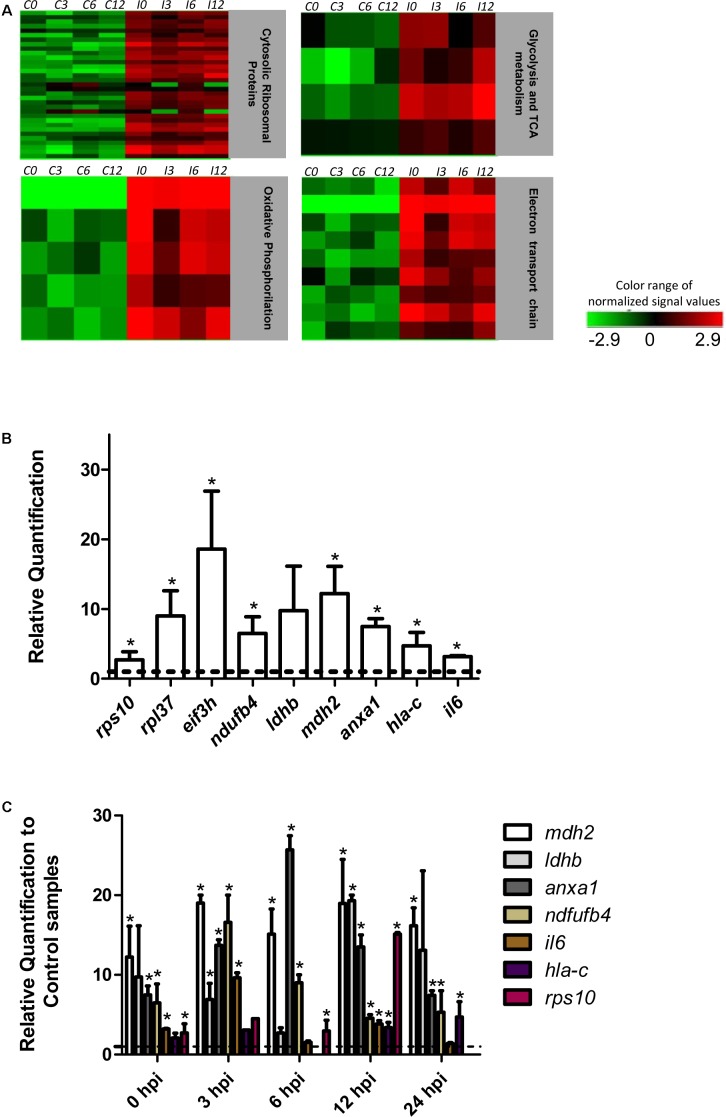
FIGURE 2.
Pathway analysis and RT-qPCR. (A) Heat map of the most significantly altered pathways from the differentially expressed genes (p ≤ 0.01 Fc ≥ 2). C and I denotes control and infected cardiomyocytes respectively. (B) Quantification of selected genes by real-time PCR. The bars shows the relative fold changes of up-regulated genes (rps10, rpl37, eif3h, ndufb4, ldhb, mdh2, anxa1, hla-c) analyzed by qPCR at t0. Values are means of three biological replicates ± SEM. ∗p ≤ 0.05. The dotted line shows the value at which there is no difference in expression (1) between infected and control cells. (C) Kinetic expression analysis between 0–24 hpi in respect to each control by qPCR for selected genes. The dotted line shows the value at which there is no difference in expression (1) between infected and control cells. Values are means of two or three biological replicates ± SEM. ∗p ≤ 0.05.

