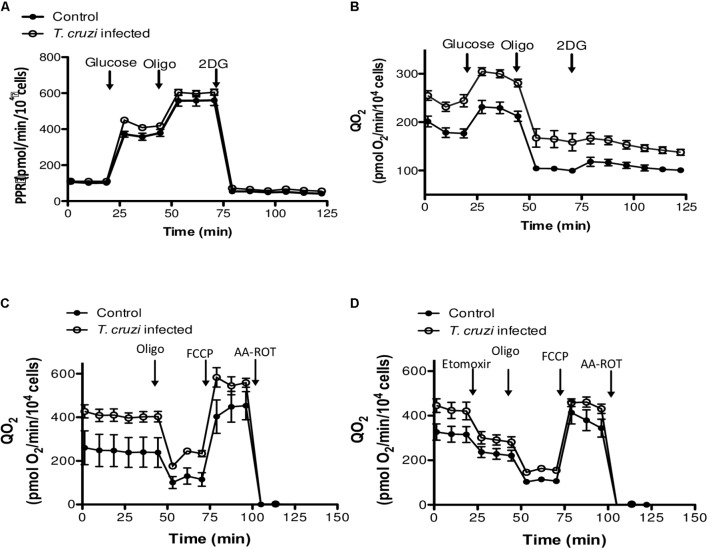
FIGURE 4.
Evaluation of glucose and fatty acid metabolism. (A) Kinetic of the PPR response of control and T. cruzi infected cardiomyocytes (24 hpi) to glucose (10 mM), oligomycin (2 μM) and 2-DG (100 mM). (B) Cardiomyocyte QO2 response of control and T. cruzi infected cardiomyocytes (24 hpi) to glucose (10 mM), oligomycin (2 μM) and 2-DG (100 mM). (C,D) Kinetic of QO2 response in the absence (E) or presence (F) of the CPT1 inhibitor etomoxir (100 μM), oligomycin (2 μM), FCCP (1 μM), and AA-ROT (1 μM each) in control and T. cruzi infected cardiomyocytes at 24 hpi. Culture media was the Human Cardiomyocytes Primary Cell Culture (Celprogen).

