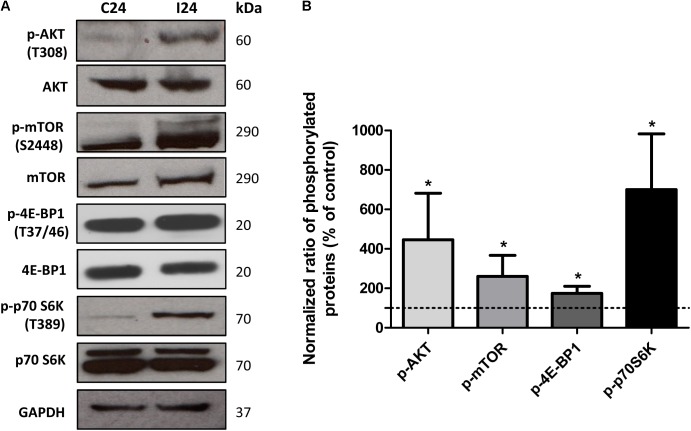
FIGURE 6.
Analysis of AKT/mTORC1 pathway. (A) Western blot analysis of phosphorylated and non-phosphorylated AKT, mTOR, 4EBP1, p70S6k in control and T. cruzi infected cardiomyocytes at 24 hpi. GAPDH was used as loading control. (B) Densitometry analysis of western blots. Values represents the mean ± standard deviation of three or two independent biological replicates (∗p < 0.05).

