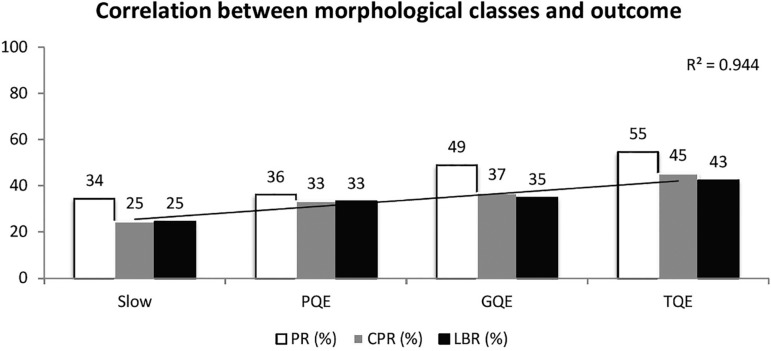
Figure 5.
Correlation between morphological classes and outcome, for all embryos included in the study. The LBR increases from 25% for PQE, to 43% for TQE. PQE = poor quality embryos, GQE = good quality embryos, TQE = top quality embryos, PR = pregnancy rate, CPR = clinical pregnancy rate, LBR = live birth rate. A regression curve with correlation coefficient is presented for LBR.

