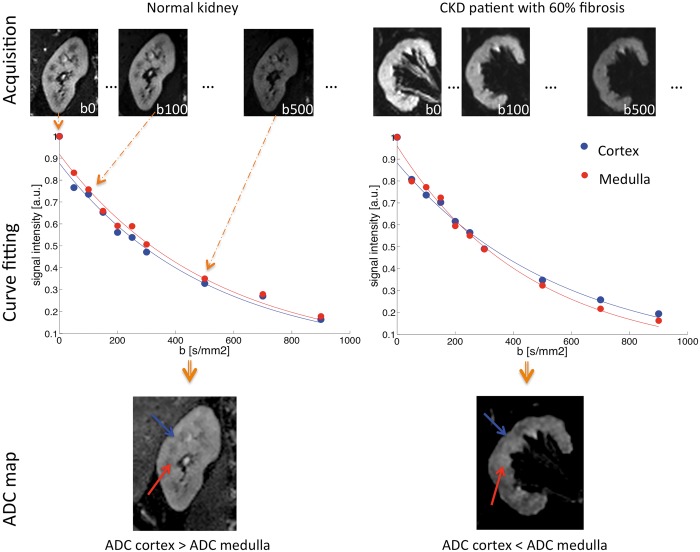
FIGURE 1:
Illustration of the principles of renal DWI in a normal volunteer and a CKD patient with 60% of renal fibrosis. First, a series of renal MRI with varying degrees of diffusion weighting are acquired as shown in the first row. Then, the ADC, an estimation of the water molecule motion in the tissue, is extracted from these images by curve fitting. An example of the ADC fit is presented in the graphs in the middle row. Note the difference in the cortical and medulla fits between the normal volunteer without fibrosis and the CKD patient. The medulla curve in the CKD patient has a stronger curvature reflecting an increased ADC. Finally, the result of fit for each pixel is displayed in a new image called an ADC map (bottom row). In the normal volunteer (on the left), the ADC is higher in the cortex (blue arrow) than in the medulla (red arrow). The opposite is found in the CKD patient (on the right), where the ADC is higher in the medulla than in the cortex in agreement with the curve fits. This inversion of cortico-medullary ADC difference is correlated with the amount of fibrosis present in the CKD patient.

