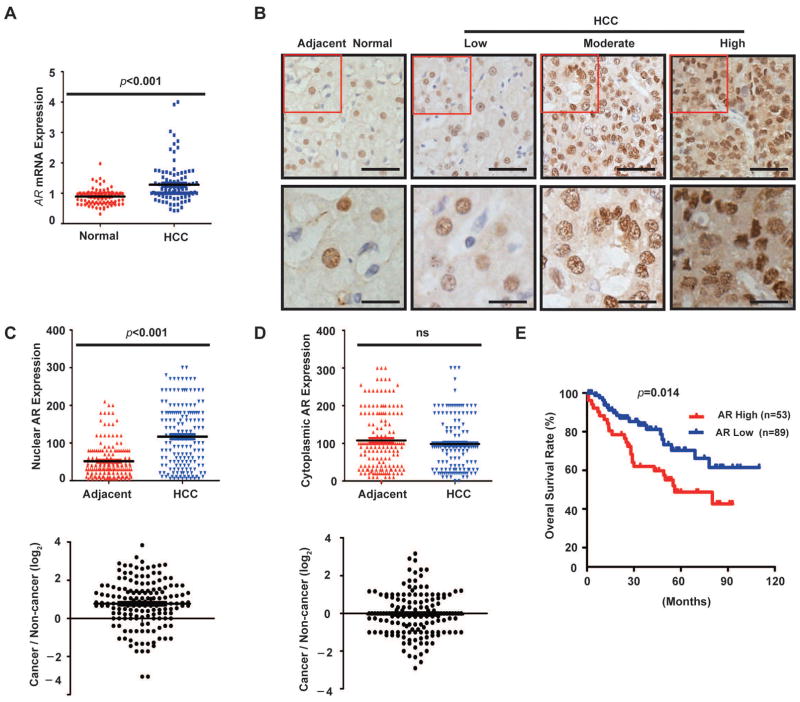
Fig. 1. Nuclear AR is overexpressed in HCC, which is associated with tumor progression and poor prognosis.
(A) AR mRNA is overexpressed in a subset of HCC. AR mRNA expression data is downloaded from an OncoMine microarray dataset that includes 104 HCC and 76 normal liver tissues. The results were analyzed by student’s t-test (bar represents mean value).
(B) Representative AR immunohistochemistry (IHC) staining in primary HCC and adjacent noncancerous liver tissues (scale bar 50 μm).
(C) Scatter plots of nuclear AR IHC scores in HCC and adjacent noncancerous liver tissues. Bar represents mean value (N = 142, paired t-test). The lower panel shows the ratio of nuclear AR in paired tumor/adjacent noncancerous tissues.
(D) Scatter plot of cytoplasmic AR IHC scores in HCC and adjacent noncancerous liver tissues. Bar represents mean value (N = 142, sample-paired t-test). The lower panel shows the ratio of cytoplasmic AR in paired tumor/adjacent noncancerous tissues.
(E) Kaplan-Meier analysis of overall survival in patients with high and low nuclear AR expression.

