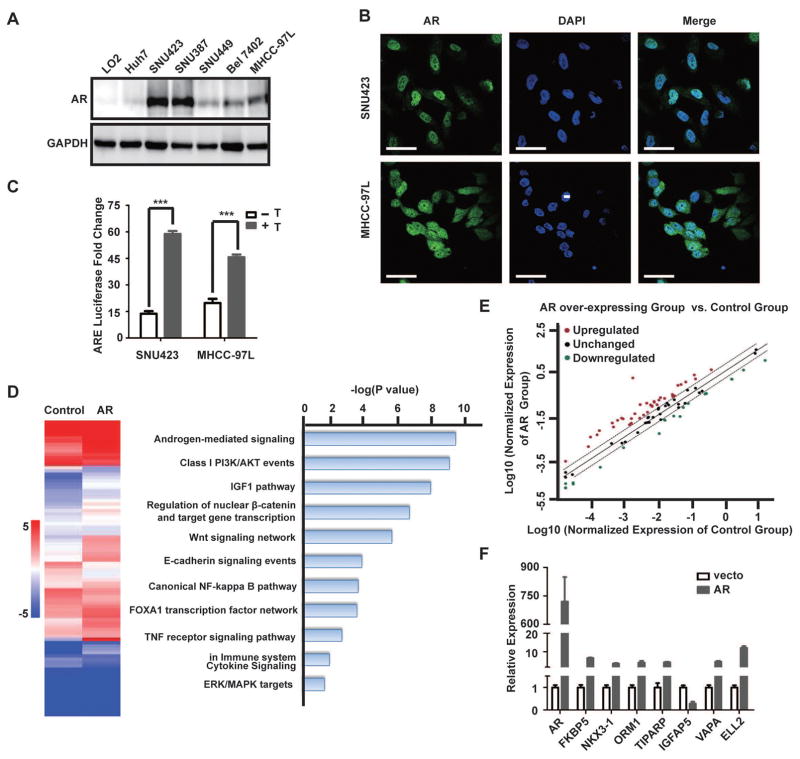
Fig. 2. AR overexpression promotes AR-dependent transcriptome in HCC cells.
(A) AR protein expression in a panel of immortalized liver and HCC cell lines as determined by immunoblot. GAPDH serves as a loading control (top panel).
(B) AR is predominantly localized in the nucleus of SNU423 and MHCC-97L cells. Shown is immunofluorescent (IF) staining of AR in SNU423 and MHCC-97L cells. The nuclei were counterstained by DAPI. Scar bar, 50 μm.
(C) Luciferase reporter driven by androgen response element (ARE) was measured in the presence or absence of testosterone for 24 h in SNU423 and MHCC-97L cell lines. Data (mean ± SD, n = 3) were analyzed by unpaired two-tail t test; *** p < 0.001.
(D) AR overexpression significantly alters AR-dependent transcriptome in HCC cells. SNU449 cells were infected with a lentiviral AR-Flag or a control lentivirus, and analyzed for the expression of key AR target genes using the Human Androgen Receptor Signaling Targets PCR Array. Left panel shows a heat map of key AR target genes in control and AR overexpressing cells. Right panel shows biological pathways enrichment in differentially expressed key AR target genes. Data were analyzed using the Database for Annotation, Visualization and Integrated Discovery (DAVID).
(E) Scatter plot identifies differentially expressed AR target genes due to AR overexpression. Red and green dots indicate with significantly increased or decreased AR target genes, respectively, in AR overexpressing cells versus control cells.
(F) qRT-PCR analysis of eight randomly selected AR target genes to verify results from the Human Androgen Receptor Signaling Targets Array. GAPDH was used as an internal control. Data (mean ± SD, n = 3) were analyzed by Student’s T test; * p < 0.05.

