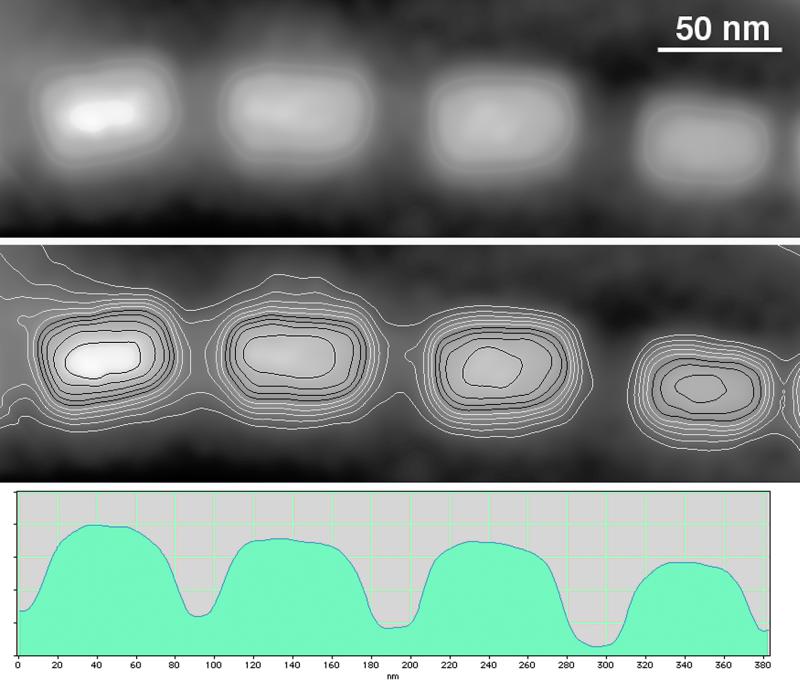
Figure 2.
An electron holographic phase image, in which the contrast is proportional to projected thickness, obtained from four representative MV-1 crystals both without (Top) and with (Middle) equally spaced contours. Each phase contour spacing of 0.47 radians corresponds to a thickness of 4.6 nm. (Bottom) Lengthwise cross sections of these crystals. The vertical scale is proportional to the measured phase shift in radians.

