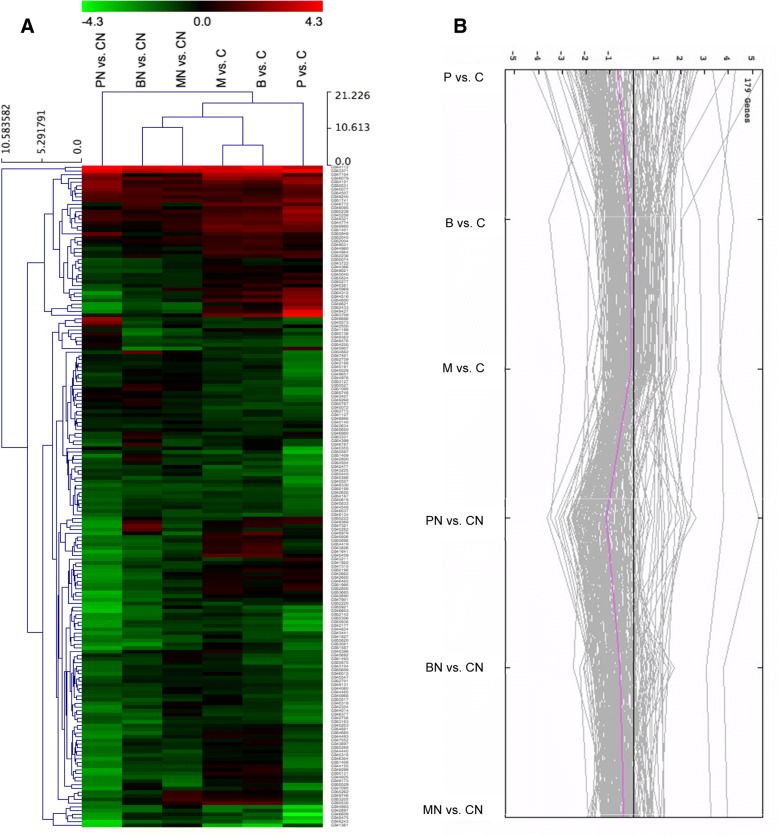
Fig. 1.
Hierarchical cluster analysis of functionally known DEGs. a Select number of genes figuring at list in 2 treatments. PN vs. CN, BN vs. CN, and MN vs. CN are, respectively, pollen, BeePro and MegaBee diet effects compared to carbohydrates in presence of Nosema. P vs. C, B vs. C and M vs. C are the same effects, respectively, compared to carbohydrates in absence of Nosema. b Expression graph corresponding to the select DEGs represented in the hierarchical cluster analysis

