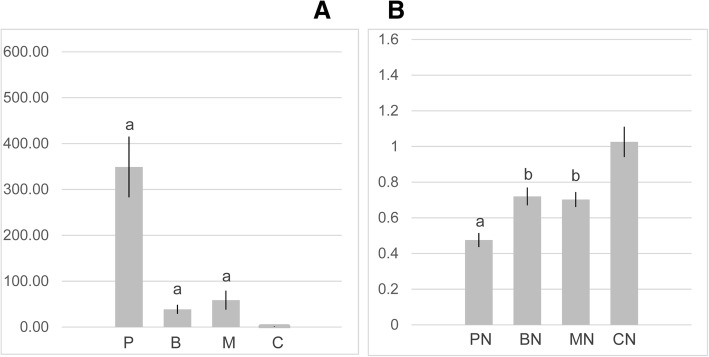
Fig. 7.
Vitellogenin (Vg) and Duox relative expression measured by qPCR. a Healthy bees were fed pollen (P), Bee-Pro (B), MegaBee (M) or carbohydrates (C; [control]); regulation of Vg in the proteinaceous treatments was determined compared to C; significance levels are indicated with letters b (p < 0.01) and a (p < 0.001); error bars represent the standard error. b Nosema-infected bees were fed pollen (PN), Bee-Pro (BN), MegaBee (MN) or carbohydrates (CN); Duox regulation by the rich diets was determined compared to CN; significance levels are indicated with letters b (p < 0.01) and a (p < 0.001); Wilcoxon’s test performed when p < 0.001; error bars represent the standard error

