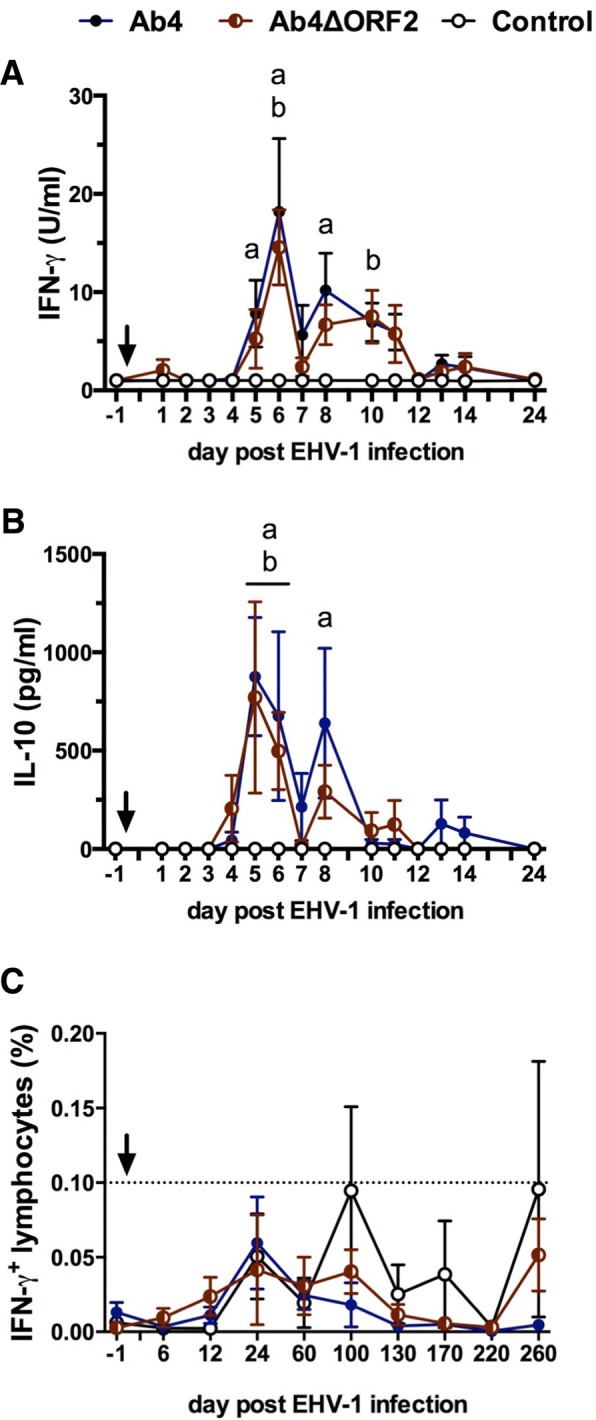
Fig. 5.

Cellular immune responses to infection in PBMC. Three groups of horses (n = 8/group) were either not infected (control), infected with the neuropathogenic EHV-1 strain Ab4 (Ab4) or infected with its ORF2 deletion mutant (Ab4ΔORF2) on day 0 (arrow). PBMC were isolated before (day − 1) and after infection (day 1–24) and re-stimulated ex vivo for 48 h with EHV-1 (strain Ab4). Cytokine production (a and b) was analyzed in supernatants by a fluorescent bead-based multiplex assay. All values are cell culture medium control corrected. Mean and standard errors of secreted IFN-γ (a) and IL-10 (b) are shown. EHV-1 stimulated PBMC were also fixed, stained for intracellular IFN-γ and analyzed by flow cytometry. Total EHV-1 specific IFN-γ producing lymphocytes are displayed (c). Values have been corrected by the respective medium control of each horse. The dotted horizontal line (c) represents a cutoff of 0.1% IFN-γ + lymphocytes. PBMC controls kept in medium alone typically result in values below this cutoff value. Significant differences between groups are marked: a = Ab4 vs. control, b = Ab4ΔORF2 vs. control, c = Ab4 vs. Ab4ΔORF2
