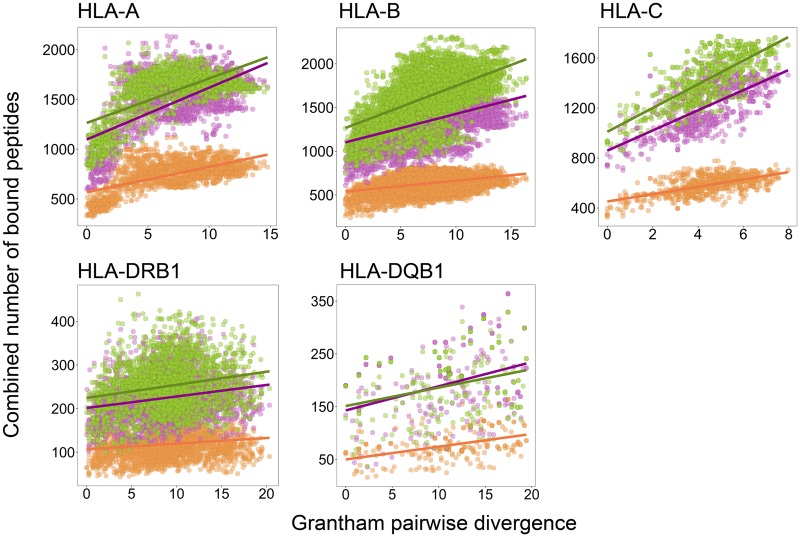
Fig. 2.
Different origins of pathogenic peptides. Correlation between pairwise genetic distances reported as Grantham distance (x axes) and number of bound peptides (y axes) calculated for all possible pairs of common HLA alleles. Each dot represents an allele pair. Binding prediction analyses performed considering proteins within three groups of pathogens: extracellular (orange, n = 57 proteins), intracellular (green, n = 100), and intra-extracellular (purple, n = 75).

