
Figure 18.
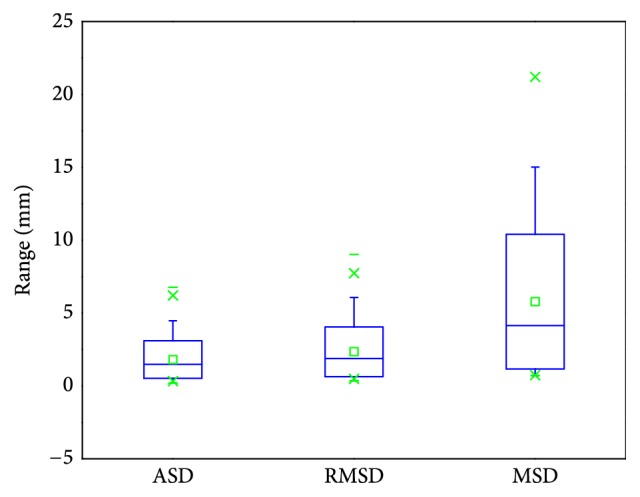
Results of surface metrics (ASD, RMSD, and MSD) for the 3Dircadb data, presented as a boxplot, where squares indicate the mean values.
Official websites use .gov
A
.gov website belongs to an official
government organization in the United States.
Secure .gov websites use HTTPS
A lock (
) or https:// means you've safely
connected to the .gov website. Share sensitive
information only on official, secure websites.
Results of surface metrics (ASD, RMSD, and MSD) for the 3Dircadb data, presented as a boxplot, where squares indicate the mean values.