
Figure 20.
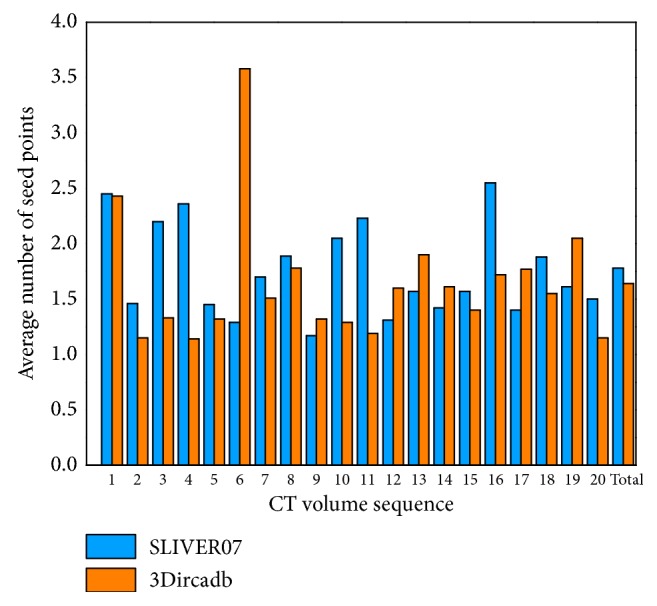
Bar chart: average number of seed points required for each CT image of all 40 CT volumes.
Official websites use .gov
A
.gov website belongs to an official
government organization in the United States.
Secure .gov websites use HTTPS
A lock (
) or https:// means you've safely
connected to the .gov website. Share sensitive
information only on official, secure websites.
Bar chart: average number of seed points required for each CT image of all 40 CT volumes.