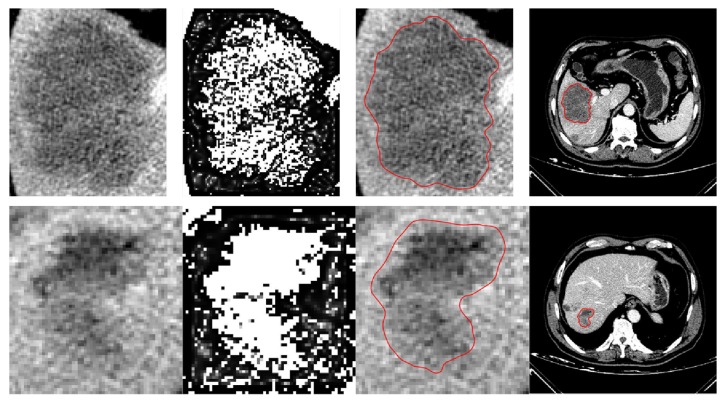
Figure 9.
Two examples of challenging liver tumor segmentation: (rows) from top to bottom: a tumor case with an ambiguous and variable edge and a tumor case with low contrast and intensity inhomogeneities; (columns) from left to right: the original ROIs, the enhanced edge indicators, the segmentation results denoted by red lines, and the results shown in full images.

