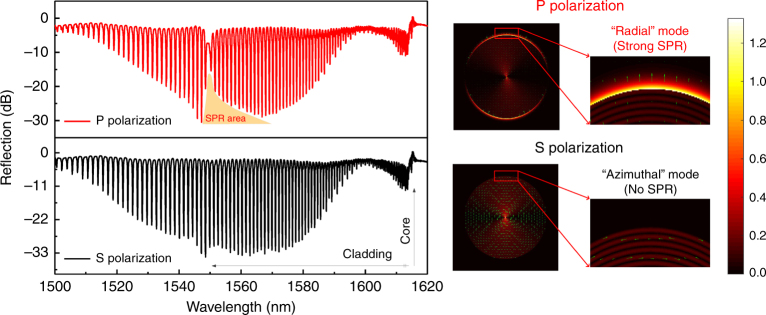
Fig. 7. (Left) Reflection spectra of a mirror-ended TFBG optical fiber coated with 50 nm of gold and immersed in water.
P-polarized incident light showing SPR near 1550 nm (red curve) and S-polarized incident light (black curve, no SPR observed); (right) Simulated electric mode field profiles for two neighboring high-order cladding modes: modes excited by P-polarized core mode input light have electric fields that are oriented predominantly radially at the boundary (upper), while modes excited from S-polarized input have predominantly tangential electric fields around the fiber cladding boundary (bottom). The color scale reflects the magnitude of the electric fields and the arrows their orientation. The transfer of energy from cladding mode to a surface plasmon shows up as a bright ring around the fiber cladding for P-polarized input

