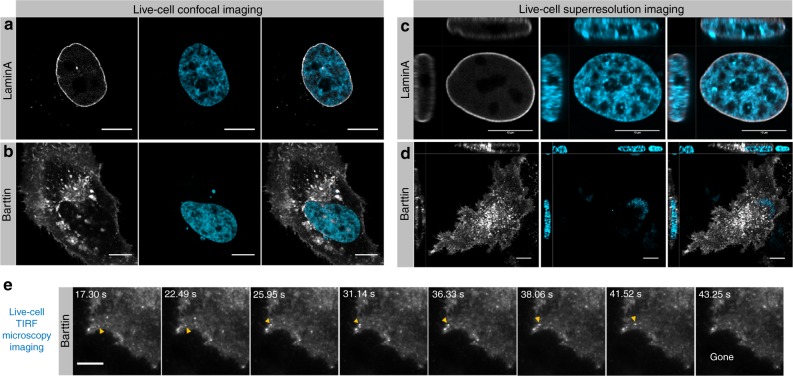
Fig. 3. Confocal, Airyscan and TIRF microscopy imaging of live cells after photoporation with SNAP ligand.
a, b Confocal images of live HeLa cells after photoporation with SNAP-Surface® Alexa Fluor® 647 (gray; left). Cells were first transfected with SNAPLaminA or SNAPBarttin. The nuclei are stained with Hoechst (cyan; middle). The right column are merged images. c, d Similarly, transfected and labeled live cells were imaged by Airyscan super-resolution microscopy. The right column are merged images. e Time-lapse TIRF microscopy images of Barttin-labeled HeLa cells. The yellow arrowhead indicates vesicle-mediated transport of Barttin. Scale bars are 10 µm

