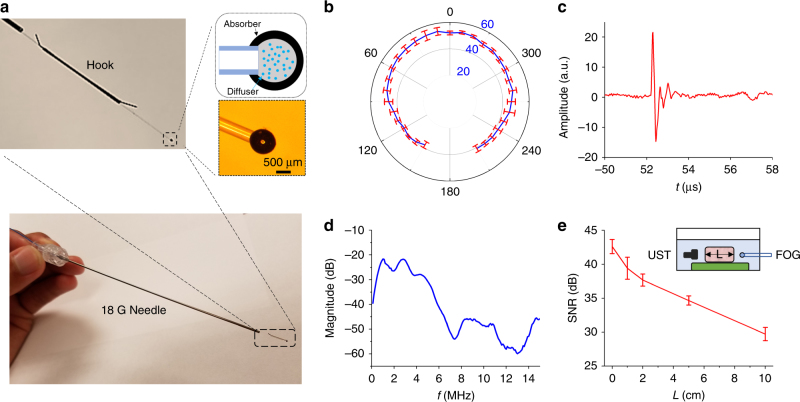
Fig. 2. A fiber optoacoustic guide for tumor localization with sub-millimeter accuracy.
a Photograph of the fiber optoacoustic guide (FOG), zinc oxide nanoparticles, and epoxy forming the diffuser layer to diffuse the light, and the graphite and epoxy layer converts the light into an optoacoustic signal. b Signal-to-noise ratio (SNR) of the generated optoacoustic signal from the FOG tip at different angles. The radius of the data points marks its SNR (in dB): the further the data point lies, the higher the SNR is. c Representative optoacoustic signal waveform recorded 8 cm away from the FOG tip in the forward direction. d Frequency spectrum of the representative optoacoustic signal waveform after normalization of the detector’s response. e SNR of the generated optoacoustic signal after passing chicken breast tissue of different thicknesses: 0, 1, 2, 5, and 10 cm. The inset shows the measurement setup

