Fig. 3.
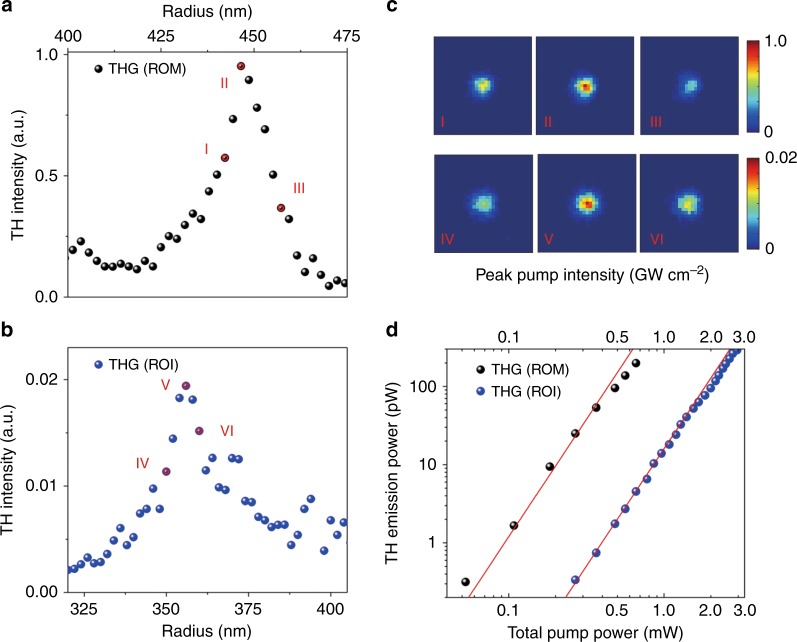
Experimentally measured TH intensity for a ROM and b ROI configurations for different disk radii around the anapole resonances. c The corresponding TH intensity image for several disk radii around the anapole resonances. d Measured TH power as a function of pump power, where the cubic dependence is given by the red lines y = 1200x3 (ROM) and y = 16x3 (ROI). The peak pump intensity was estimated from the average pump power with 1 ps pulses at a 40 MHz repetition rate

