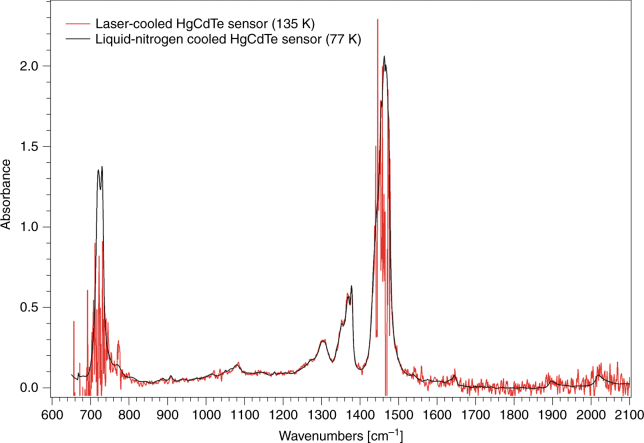
Fig. 8. FTIR spectroscopy using a laser-cooled HgCdTe infrared sensor.
FTIR spectrum of a sheet of low-density poly-ethylene (LDPE) measured with the laser-cooled HgCdTe sensor (135 K, red trace) and, for comparison, an equivalent liquid-nitrogen cooled HgCdTe sensor (77 K, black trace). The larger relative noise observed at the extremes of the spectra is simply a result of the smaller signal (HgCdTe sensitivity and/or source brightness) in these regions; the noise amplitude is wavelength-independent

