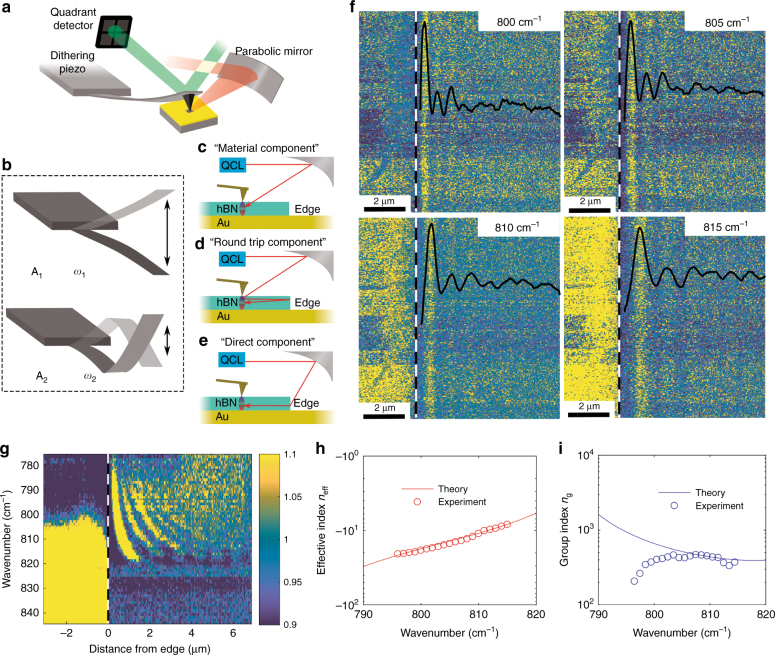
Fig. 2. PIFM hyperspectral nano-imaging in the RS1 band.
a Schematic diagram of the PiFM setup. A mid-IR laser is focused on the AFM tip close to the sample surface by means of a parabolic mirror. The mechanical oscillations of the cantilever are detected by means of a quadrant photo-detector. b First and second mechanical eigenmodes of an AFM cantilever. The second eigenmode has a resonance frequency of ~6.3 times the resonance frequency of the first eigenmode. c–e The contributions of the three possible paths to the measured signal. The material component (c) is due to the local polarizability of the material. The roundtrip component d is due to a polaritonic guided mode that originates from the AFM tip and couples back to the tip after being reflected from the flake edge. The direct component (e) originates from a polaritonic mode that is directly coupled into the flake via scattering at the edge. f PiFM imaging (and profile) of the fringes that are induced by the interference of the guided modes with the material component at the tip location for various frequencies (wavenumbers) of the illuminating light in the first RS band. The white dashed line represents the position of the flake edge. g Plot of the PiFM signal intensity as a function of the distance from the edge and the illuminating light frequency. This plot is obtained by averaging each of the images at a specific illuminating wavelength along the vertical axis (parallel to the flake edge) and is used to retrieve the experimental data that are plotted in h and i. Since our imaging is hyperspectral, all the images at a specific wavelength are obtained in a single scan where a full spectrum is recorded at each position (pixel) of the scanned area. h, i Analytical (Equation 1) and measured modal phase and group effective index as functions of the illuminating light frequency. The group velocity is ~500 times slower than the speed of light in free space. In Fig. 2i, the deviation of the experimental data from the theoretical prediction is a consequence of reduced laser power below 800 cm−1. This results in the deterioration of the signal-to-noise ratio in the imaging and a large uncertainty in the calculation of the derivative , which provides the group refractive index

