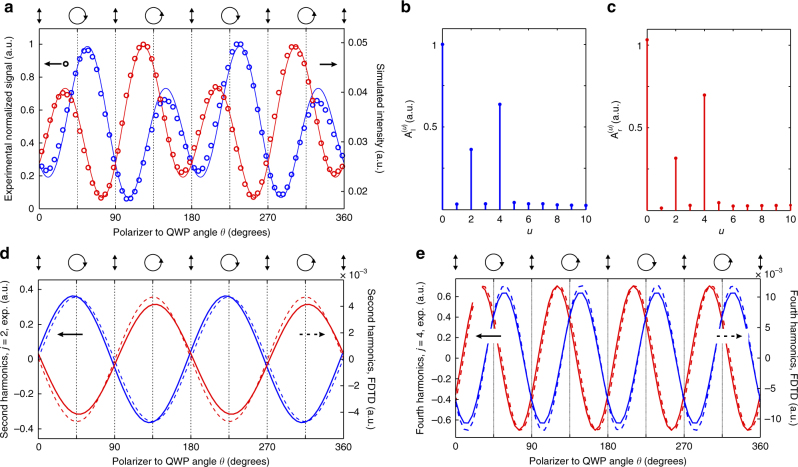
Fig. 4.
Magnetic spin-orbit interaction steers Bloch surface waves. a Detected signals (circles) and simulated intensities (FDTD method, solid lines) on the right and left BSWs as a function of the angle θ between the quarter-wave plate and the polarizer. The curves related to the right and left BSWs are represented by red and blue colors, respectively. b, c Spectrum (amplitude) of the experimental blue and red curves of a, obtained by Fourier transformation. Coefficient u defines the harmonic orders for the Fourier series. d, e Representation in the real space of the non-null harmonics for the two Fourier series shown in b and c: d second harmonics and e fourth harmonics. Experimental and numerical curves are shown by the solid and dashed lines, respectively

