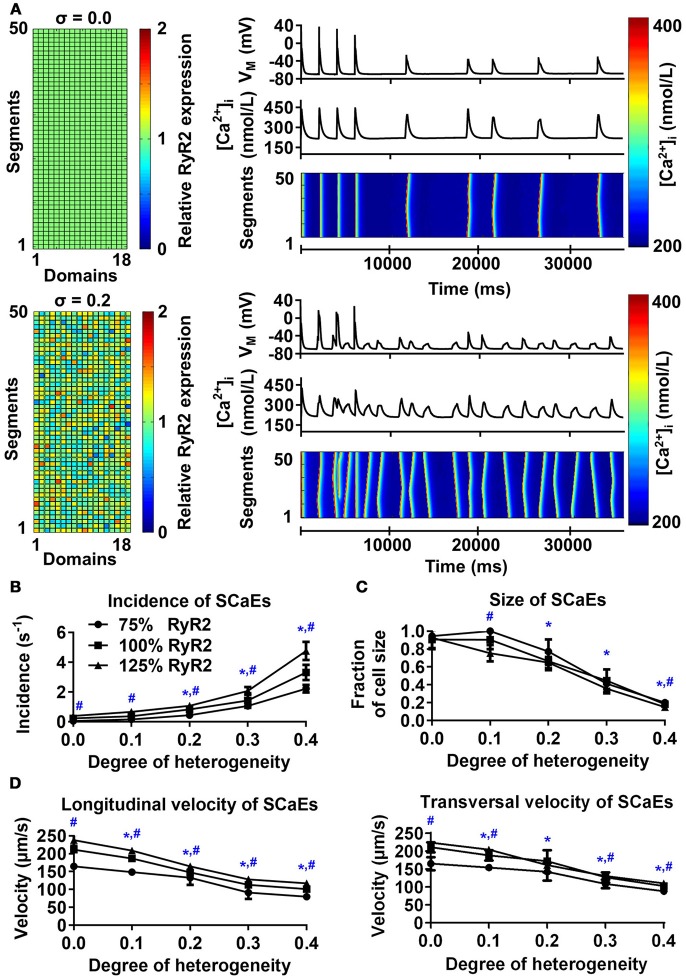
Figure 1.
Effects of RyR2 distribution heterogeneity on spontaneous Ca2+-release events (SCaEs) in the 50-segment model. (A) Representative examples comparing heterogeneity (σ) of 0.0 (uniform expression, top) and 0.2 (bottom). The 50 × 18 matrices (left) show the relative RyR2 distribution. The membrane potential (VM), whole-cell Ca2+ concentration, and longitudinal line scan on the right show marked differences in number of SCaEs and corresponding delayed afterdepolarizations between both groups. (B–D) SCaE incidence (B) and size (C), as well as longitudinal and transversal velocity of Ca2+ waves (D) as a function of RyR2 heterogeneity σ for different levels of total RyR2 expression (75% of control: circles; 100% of control: squares; 125% of control: triangles). SCaE incidence increases, while size decreases with increasing RyR2 heterogeneity. *indicates P < 0.05 vs. the group with heterogeneity 0.0 and #indicates statistically significant differences among three levels of RyR2 expression; n = 6 per condition.

