Figure 3.
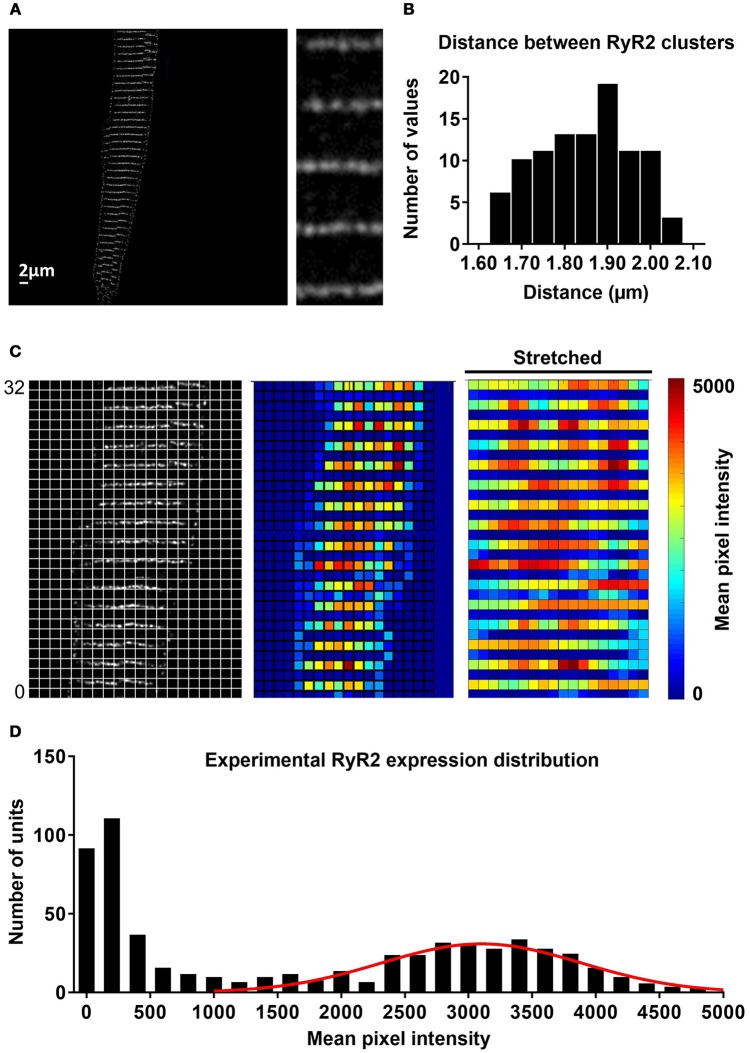
Experimental distribution of RyR2 expression in atrial cardiomyocytes. (A) Confocal image of RyR2 staining in a rabbit atrial cardiomyocyte. Inset shows region of interest at higher magnification, revealing that RyR2 clusters assemble in a regular banded pattern along the Z-band. (B) Distribution of distances between RyR2 bands, showing that majority of these gaps were around 1.8–1.9 μm. (C) Image processing of confocal images and alignment with a regular grid of ~1 μm2 units (left) enabled quantification of local RyR2 expression (right panel, red indicates high local RyR2 expression and blue low local RyR2 expression). (D) Histogram of experimental RyR2 expression distribution across all units with a large peak around 0, representing units between bands of RyR2 expression and a normal distribution of RyR2 expression within bands (line shows normal distribution with standard deviation of 0.253).

